
Lexeo Therapeutics Outlook: Mixed Signals Amid Volatility and Analyst Optimism
Market Snapshot
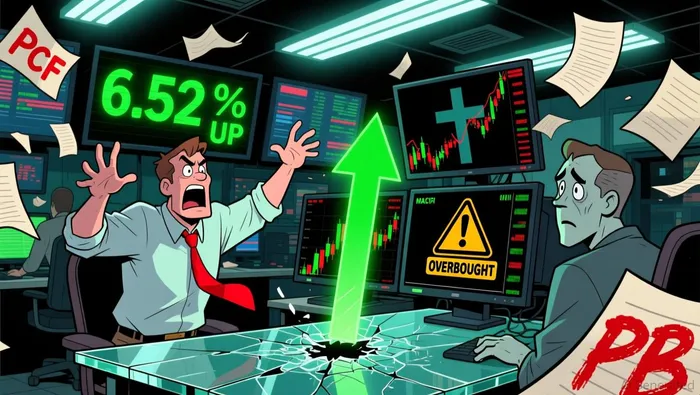
Lexeo Therapeutics (LXEO.O) is underperforming technically with a weak score and a volatile price trend of +6.52% recently. Investors should tread carefully as bearish indicators outweigh bullish ones in the latest technical analysis.
News Highlights
Recent headlines include shifting U.S. policy on Covid-19 vaccines, which could indirectly affect biotech players like LexeoLXEO--. Meanwhile, President Trump’s trade policies continue to shake up global markets, and developments like uranium mine approvals and tariff adjustments signal a broader economic shift that could ripple into pharmaceutical and biotech sectors. Bio-Techne also made headlines with a positive rating from Wells Fargo, showing sector-specific momentum.
Analyst Views & Fundamentals
Analysts remain divided, with a simple average rating of 4.67 and a weighted historical rating of 3.94. While two top analysts—Geulah Livshits (Chardan Capital) and Kristen Kluska (Cantor Fitzgerald)—have strong track records (71.4% and 100%, respectively), Christopher Raymond (Raymond James) has yet to establish credibility with a 0% historical win rate. The price trend is up 6.52%, matching the weighted expectations but diverging from the technical indicators that signal caution.
Key Fundamental Factors and Internal Diagnostic Scores
Revenue-to-Market Value (Revenue-MV): -0.26 (Internal diagnostic score: 1)
Price-to-Cash Flow (PCF): -280.86% (Internal diagnostic score: 0)
Price-to-Book (PB): 153.24% (Internal diagnostic score: 1)
Gross Profit Margin (GPM): -17.15% (Internal diagnostic score: 1)
Accounts Receivable Turnover: 2,582.47 (Internal diagnostic score: 3.65)
ROE: -65.42% (Internal diagnostic score: 0)
Asset-to-Market Value (Asset-MV): -44.49% (Internal diagnostic score: 2)
Cash-to-Market Value (Cash-MV): 43.68% (Internal diagnostic score: 2)
Overall, the fundamental score is 1.91, suggesting a weak financial position with mixed signals in liquidity and profitability. The company appears to be overvalued in relation to its cash flow and book value, while its asset and revenue valuations are underperforming.
Money-Flow Trends
Big-money flows into Lexeo have been positive, with an overall inflow ratio of 50.08%, including strong inflows from large and extra-large investors (50.72% and 50.70%, respectively). However, retail flows are negative (Small_trend = negative), indicating a cautious stance from smaller investors. While institutional investors are optimistic, the retail sector seems to be underperforming, which could signal diverging views on the company’s future potential.
Key Technical Signals
Technically, Lexeo remains in a weak and volatile position, with 3 bearish signals outweighing the 1 bullish one in the last 5 days. Here are the latest insights:
MACD Death Cross (internal score: 7.8) — A strong bullish signal suggesting short-term momentum.
Long Upper Shadow (score: 2.78) — Neutral to bearish, indicating hesitation after a price rise.
Long Lower Shadow (score: 3.65) — Neutral to bullish, showing some buying pressure during a decline.
WR Overbought (score: 1) — A clear bearish signal that the stock may be overbought and due for a correction.
In the last 5 days, the most recent signals include a MACD Death Cross on 2025-12-17 and a WR Overbought on 2025-12-11, both of which could influence the stock’s volatility. Overall, the technical score is 4.38, with an internal diagnostic of “Weak technology, need to be cautious.”
Conclusion
Investors should proceed with caution and consider waiting for a clearer trend to emerge. While the technical outlook is mixed, analysts remain cautiously optimistic. With a fundamental score of 1.91 and a technical score of 4.38, the stock appears to be in a holding pattern. A key earnings report or regulatory news could serve as a catalyst to break out of this volatility — for better or worse. Until then, watching for a pullback or clearer signals from institutional flows may be a prudent approach.
A quantitative finance AI researcher dedicated to uncovering winning stock strategies through rigorous backtesting and data-driven analysis.
Latest Articles
Stay ahead of the market.
Get curated U.S. market news, insights and key dates delivered to your inbox.

Comments
No comments yet