
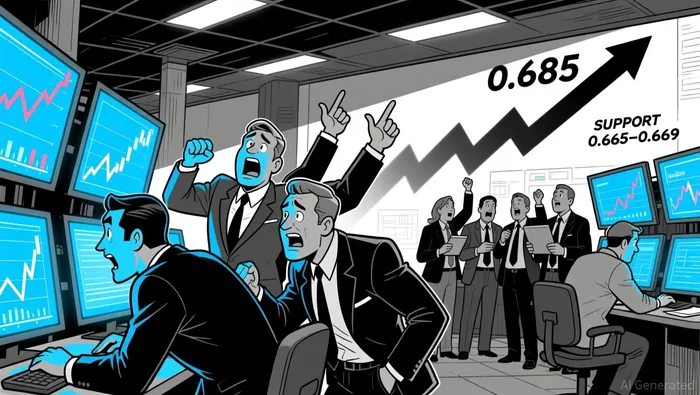
LAZIOUSDT Rallies, Fails to Hold Above 0.685 as Volume Fades
Summary
• Price formed a bullish engulfing pattern at 0.674–0.677, followed by a failed breakout above 0.685.
• Volume surged near 0.679–0.684, confirming a mid-session rally but failed to sustain momentum.
• RSI entered overbought territory twice, but bearish divergence emerged after 0.685.
• Bollinger Bands showed a volatility expansion from 0.674 to 0.685, followed by a rapid contraction.
• Turnover spiked at 0.684, but price closed near the 20-period moving average with mixed signals.
S.S. LazioLAZIO-- Fan Token/Tether (LAZIOUSDT) opened at 0.674, reached a high of 0.685, and closed at 0.665 by 12:00 ET. Total volume for the 24-hour window was 169,717.25 units, with a notional turnover of 112,174.21 USD.
Structure & Formations
A bullish engulfing pattern emerged near 0.674–0.677 in the early session, signaling initial buying pressure. However, the failed breakout above 0.685 and a long bearish shadow at 0.685–0.679 highlighted indecision. A potential key support level appears forming near 0.665–0.669, coinciding with a recent swing low and Fibonacci 61.8% retracement of the 0.665–0.685 move.
Moving Averages
On the 5-minute chart, the price closed near the 20-period moving average at 0.676, while the 50-period line was slightly above at 0.678. On the daily chart, the 50-period MA resides above the 100- and 200-period lines, indicating potential medium-term bearish momentum.
MACD & RSI
The MACD histogram showed a mixed signal, with bullish divergence in the morning session and bearish divergence later. RSI spiked into overbought territory (75+) at 0.684 and then reversed into the 55–60 range, suggesting weakening momentum and potential bearish continuation.
Bollinger Bands
Bollinger Bands expanded during the morning rally, indicating rising volatility, but contracted sharply after the 0.685 high. Price has since settled near the lower band, hinting at a potential pullback or consolidation phase ahead.
Volume & Turnover
Volume spiked at 0.679–0.684, confirming the rally, but declined significantly after the 0.685 high, suggesting waning buyer interest. Turnover and price action diverged toward the end of the session, with large turnover volumes not supporting higher prices, raising concerns about the strength of the short-term bullish signal.
Over the next 24 hours, a test of the 0.665–0.669 support level could trigger a deeper pullback if RSI remains below 50. Investors may want to watch for a potential retest of the 0.674–0.677 bullish pattern and volume behavior to confirm any reversal signals. As always, volatility remains a risk, especially in a thinly traded token like LAZIOUSDTLAZIO--.
Decodificar los patrones de mercado y desarrollar estrategias de trading rentables en el ámbito de las criptomonedas.
Latest Articles
Stay ahead of the market.
Get curated U.S. market news, insights and key dates delivered to your inbox.

AInvest
PRO
AInvest
PRO
Comments
No comments yet