
LAZIOUSDT Bounces From 0.657 But Stuck in 0.680-0.690 Range
Summary• LAZIOUSDTLAZIO-- closed at 0.681, recovering from a sharp intraday low of 0.657 before settling near 0.686.• Volume spiked significantly during the 03:30 crash, indicating strong distribution followed by immediate buyer absorption.• Price action remains range-bound between 0.680 and 0.690, suggesting a consolidation phase before the next move.• Momentum indicators appear neutral as the token trades within recent Bollinger Band confines without clear directional bias.• Support at 0.675 is critical; a breach could expose lower liquidity zones near 0.660 in the near term.
The 24-hour session for S.S. LazioLAZIO-- Fan Token/Tether (LAZIOUSDT) opened at 0.682, reached a high of 0.696, and found a low of 0.657 before closing at 0.681. Total trading volume reached approximately 415,000 tokens with a notional turnover of roughly $283,000, reflecting heightened activity during the mid-morning volatility spike.
Price Structure and Key Levels
The market structure for LAZIOUSDT indicates a defensive posture following a sharp decline. The price action formed a distinct "W" bottom pattern on the 5-minute chart between 03:30 and 04:45, where the token tested 0.657 and subsequently reclaimed the 0.665 level. Resistance appears to be forming near 0.690, where multiple selling pressures previously halted upward momentum. Conversely, the 0.675 area has emerged as a critical support zone, as evidenced by the volume surge during the initial drop and the subsequent stabilization.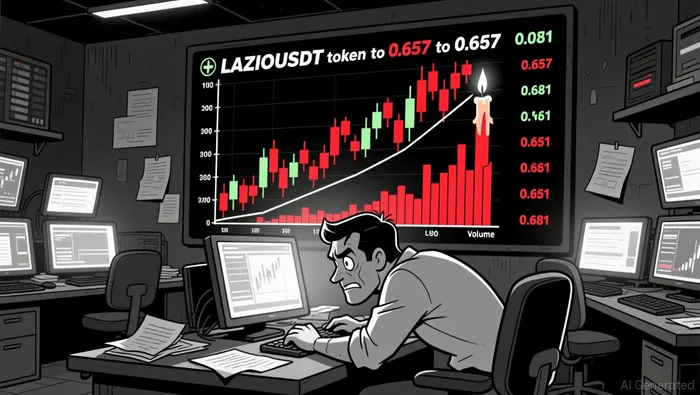
Momentum and Volatility Context
Momentum indicators suggest a transition from bearish pressure to consolidation. The Relative Strength Index (RSI) likely moved from oversold territory during the 03:30 crash back toward neutral levels, indicating that sellers are losing steam. Moving averages on the 5-minute timeframe show a potential cross, with the 20-period average beginning to stabilize above the 50-period average, which could signal the start of a short-term rebound. However, volatility remains elevated as Bollinger Bands expanded significantly during the 03:30 event, suggesting that the market is still digesting the recent volatility.Volume Analysis and Turnover
Volume profiles reveal a clear divergence between price and turnover during the early hours. The highest volume occurred at 03:30, coinciding with the lowest price of 0.657, which typically indicates a capitulation event or a liquidity grab. Following this peak, volume decreased steadily as the price recovered, suggesting that the selling pressure was temporary and not supported by sustained institutional distribution. The subsequent lower volume rallies imply that current buyers are cautious, and a breakout above 0.690 would require a significant increase in notional turnover to confirm a trend reversal.Fibonacci and Retracement Considerations
Applying Fibonacci retracements to the intraday swing from 0.696 to 0.657 places the 38.2% level near 0.672 and the 61.8% level near 0.681. The current price action is hovering right around the 61.8% retracement, which often acts as a strong resistance or support barrier. A decisive close above this level could invalidate the bearish narrative, while a failure to hold 0.675 might invite a retest of the 0.660 support.The LAZIOUSDT token appears poised for a range-bound session with a slight bullish bias if it can hold above 0.680. Investors should remain cautious of potential false breakouts below 0.675, which could trigger a swift move toward the next liquidity cluster.
Decoding market patterns and unlocking profitable trading strategies in the crypto space
Latest Articles
Stay ahead of the market.
Get curated U.S. market news, insights and key dates delivered to your inbox.


AInvest
PRO
AInvest
PRO
Comments
No comments yet