
LayerZero Volume Spike Fails to Break Resistance
 Aime Summary
Summary
- LayerZero/USDC trades in a tight range with conflicting short-term signals.
- Significant volume spike at 02:00 UTC failed to sustain upward momentum.
- Price currently tests key resistance near 1.16, showing signs of rejection.
- Market structure remains sideways with no clear directional trend established.
- Caution advised as buyers struggle to break above immediate supply zones.
Market Overview: Range Bound with Rejection
LayerZero/USDC (ZROUSDC) closed the latest 1-hour candle at 1.114 after opening at 1.155. The 24-hour total volume was approximately 584,476 USDC, indicating moderate participation relative to historical averages.
1-Hour Support/Resistance and Candlestick Patterns
The market structure is currently range-bound, with price action oscillating between identified support and resistance levels. The most immediate resistance level appears to be 1.162, where the price reached a high of 1.162 at 06:00 UTC but failed to close above 1.165 in the subsequent hours. This level has acted as a ceiling, with price rejecting this zone multiple times, including a notable rejection at 1.162 followed by a decline to 1.114. On the support side, the level at 1.110 has provided a floor, as seen when price dipped to 1.110 at 11:00 UTC and bounced back to 1.155 before closing lower. The price is currently closer to the support level of 1.110 than the resistance at 1.162, suggesting a slight bearish bias in the immediate short term.
Candlestick patterns provide additional context for these price movements. A bullish engulfing pattern was observed at 05:00 UTC, where the body of the candle fully covered the prior candle's body, signaling a potential short-term reversal. This was followed by a long lower shadow rejection at 11:00 UTC, where the wick extended significantly below the body, indicating that buyers stepped in to push the price back up from 1.142 to 1.155. However, the subsequent candle at 12:00 UTC closed lower at 1.114, suggesting that the buying pressure was not sustained. The presence of these patterns suggests that while there are attempts to reverse, the overall momentum remains weak.
Volume and Turnover vs. Historical Comparison
To assess the significance of the recent volume, we compare the 24-hour total volume of 584,476 USDC against historical averages. The 7-day average daily volume is 1,032,076.89 USDC, and the 15-day average daily volume is 1,766,447.07 USDC. The current 24-hour volume is significantly lower than both the 7-day and 15-day averages, suggesting that the current price action is not being driven by high participation. This low volume environment often leads to more volatile price swings as fewer participants are needed to move the price.
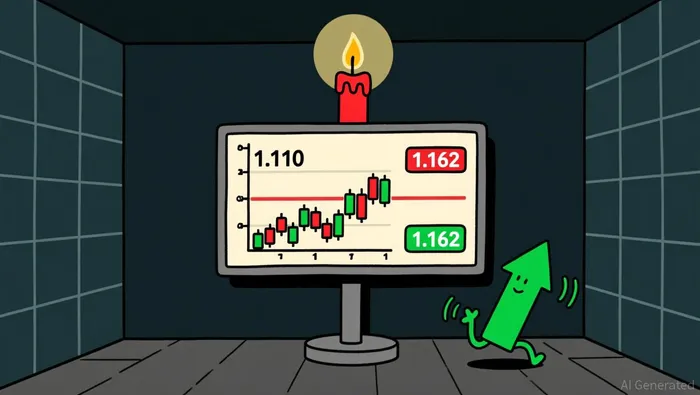
Looking at hourly volume spikes, the highest volume occurred at 02:00 UTC with 71,277.56 USDC. The 7-day average single-hour volume is approximately 43,003.2 USDC, making the 02:00 UTC volume roughly 1.65 times the average. While this is a notable spike, it did not exceed the 2x threshold required to be considered a significant anomaly. Following this spike, the price moved from 1.106 to 1.131 in the next 3 hours, a gain of approximately 2.3%. However, this gain was not sustained, and the price declined to 1.114 by 12:00 UTC. This suggests that the volume spike at 02:00 UTC did not effectively drive a sustained price increase, and the buying pressure was likely absorbed by sellers. The lack of high volume with follow-through indicates that the current price movement is not strongly supported by market participants.
Look Back: Current Market Phase
Analyzing the 7-15 day daily structure, the market appears to be in a sideways phase. The 7-day price change is 8.05%, and the 3-day price change is 4.01%, indicating some recent upward momentum. However, the 15-day daily price range is 0.36, which, relative to the current price levels, suggests a range-bound environment rather than a strong trend. The market structure feature is explicitly identified as range bound, which aligns with the observation of price oscillating between support and resistance levels without establishing a clear trend of higher highs and higher lows or lower highs and lower lows. The recent price action, with multiple rejections at resistance and support, further supports the conclusion that the market is consolidating within a defined range.
In the next 24 hours, the price may continue to test the 1.162 resistance level. A break above this level could signal a potential move towards 1.186, but this would require increased volume to confirm. Conversely, a break below the 1.110 support level could lead to a decline towards 1.085, especially if volume remains low. Traders should watch for a decisive break of these levels, as they could indicate a shift in the market phase from sideways to a trending environment.

Decoding market patterns and unlocking profitable trading strategies in the crypto space
Latest Articles
Stay ahead of the market.
Get curated U.S. market news, insights and key dates delivered to your inbox.


AInvest
PRO
AInvest
PRO




Comments
No comments yet