
Lam Research Surges 6.26% on Bullish Momentum, Technical Indicators Signal Uptrend Continuation
Generated by AI AgentAinvest Technical RadarReviewed byAInvest News Editorial Team
Tuesday, Jan 6, 2026 10:10 pm ET2min read
LRCX-- Aime Summary
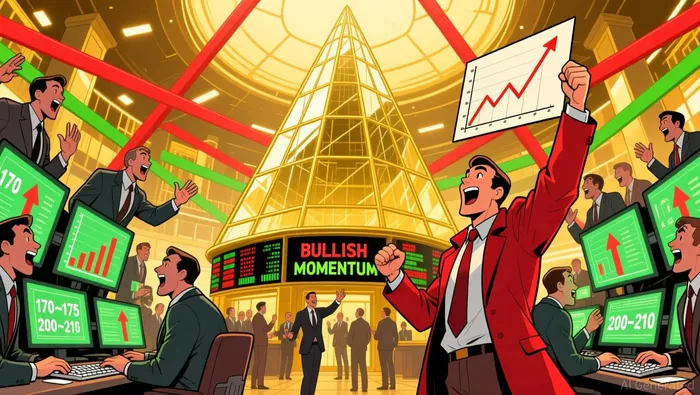 The recent price action forms a rising wedge pattern, characterized by higher highs and higher lows. Key support levels are evident around $170–$175, where the stock previously consolidated during pullbacks (e.g., mid-December 2025). Resistance is likely near $200–$210, corresponding to the recent high of $210.45 on January 6, 2026. A break above this level could signal a continuation of the uptrend, while a retest of the wedge’s lower boundary may offer a buying opportunity.
Lam Research (LRCX) has surged 6.26% in the most recent session, marking a three-day rally with a cumulative gain of 20.90%. This sharp move suggests strong short-term momentum, potentially driven by positive catalysts or renewed institutional interest. The price action reflects a bullish bias, with closing prices consistently above key moving averages and a narrowing range of volatility.
Candlestick Theory
The recent price action forms a rising wedge pattern, characterized by higher highs and higher lows. Key support levels are evident around $170–$175, where the stock previously consolidated during pullbacks (e.g., mid-December 2025). Resistance is likely near $200–$210, corresponding to the recent high of $210.45 on January 6, 2026. A break above this level could signal a continuation of the uptrend, while a retest of the wedge’s lower boundary may offer a buying opportunity. Moving Average Theory
Short-term momentum is reinforced by the 50-day moving average (approximately $185–$190) crossing above the 200-day moving average (around $170–$175), forming a bullish “golden cross.” The 100-day MA (~$180) aligns with the 50-day, suggesting sustained upward momentum. However, the 200-day MA may act as a psychological floor if the rally stalls. The alignment of multiple moving averages above current price levels indicates a strong uptrend, though a pullback to the 50-day MA could test its robustness.MACD & KDJ Indicators
The MACD histogram shows a widening positive divergence, with the line above the signal line, confirming bullish momentum. The KDJ (Stochastic) oscillator is in overbought territory (K-line at ~85, D-line at ~80), suggesting a potential near-term correction. However, the lack of bearish divergence between price and the KDJ (e.g., lower highs in the K-line despite higher price highs) reduces immediate reversal risk. A sustained close below the 200-day MA could trigger a bearish MACD crossover, signaling a shift in trend.Bollinger Bands
Volatility has expanded significantly, with the upper band at ~$210–$215 and the lower band near $170–$175. The current price is approaching the upper band, indicating overbought conditions. A break above the upper band may extend the rally, but a retest of the lower band could consolidate gains. The narrowing of the bands during prior consolidation phases (e.g., mid-December) suggests periods of low volatility preceding breakout attempts.Volume-Price Relationship
Trading volume has surged during the recent rally, with average volume of ~18.8 million shares on the January 6, 2026, session. This high volume validates the strength of the upward move. However, a divergence may emerge if volume declines during subsequent rallies, signaling weakening conviction. The consistent volume expansion aligns with the bullish price action, suggesting institutional participation.Relative Strength Index (RSI)
The RSI is currently above 70, indicating overbought conditions. While this suggests a potential pullback, the strong moving average alignment and volume suggest the uptrend may persist. A drop below 50 could confirm a correction, but a rebound above 60 may indicate renewed buying interest. Caution is warranted if the RSI forms a bearish divergence (lower highs) without a corresponding price decline.Fibonacci Retracement
Key Fibonacci levels from the recent low (~$130 in early December 2025) to the current high (~$210) include 38.2% at ~$175 and 50% at ~$170. These levels align with prior support zones and could act as critical areas for a potential bounce. A breakdown below the 61.8% retracement level (~$160) may invalidate the bullish case, targeting the previous consolidation range (~$150–$160).The confluence of bullish signals—rising wedge, golden cross, and expanding volume—strengthens the case for a continuation of the uptrend. However, overbought RSI and Stochastic levels highlight the risk of a near-term correction. Divergences to monitor include weakening volume during rallies or bearish MACD crossovers. Probabilistically, a retest of $170–$175 appears likely, with a successful hold favoring a resumption of the upward trajectory toward $220–$230.
Si he logrado avanzar más allá, es gracias a haber tomado como referencia los logros de otros grandes hombres.
Latest Articles
Stay ahead of the market.
Get curated U.S. market news, insights and key dates delivered to your inbox.
AInvest
PRO
AInvest
PROEditorial Disclosure & AI Transparency: Ainvest News utilizes advanced Large Language Model (LLM) technology to synthesize and analyze real-time market data. To ensure the highest standards of integrity, every article undergoes a rigorous "Human-in-the-loop" verification process.
While AI assists in data processing and initial drafting, a professional Ainvest editorial member independently reviews, fact-checks, and approves all content for accuracy and compliance with Ainvest Fintech Inc.’s editorial standards. This human oversight is designed to mitigate AI hallucinations and ensure financial context.
Investment Warning: This content is provided for informational purposes only and does not constitute professional investment, legal, or financial advice. Markets involve inherent risks. Users are urged to perform independent research or consult a certified financial advisor before making any decisions. Ainvest Fintech Inc. disclaims all liability for actions taken based on this information. Found an error?Report an Issue

ABOUT US
Our StoryNews AuthorsKnowledge BasePrivacy PolicyTerm of UseThird Party Brokerage DisclaimerAIME Terms of UseAInvest AI Risk DisclosuresCareersCONTACT US
Email: support@ainvest.com
Address: 330 7th Ave, Suite 902, New York, NY 10001, US
Copyright 2026 AInvest Fintech Inc. All rights reserved.
Comments
No comments yet