
Lagrange Rebounds from 0.0627 as Volatility Persists
 Aime Summary
Summary
- Lagrange/Tether (LAUSDT) exhibits high volatility with a 24-hour range spanning significant intraday swings.
- Price action shows rejection at resistance near 0.0714, indicating strong selling pressure at higher levels.
- Volume spikes on upward moves suggest institutional participation, yet follow-through remains inconsistent.
- Market structure indicates a potential mean reversion phase following recent sharp price movements.
- Traders should monitor support near 0.0627 for potential bounce opportunities or breakdown risks.
Severe Correction
Lagrange/Tether (LAUSDT) closed the 24-hour period at 0.0634, reflecting a volatile trading session with a total volume of approximately 13.5 million USDT. The asset experienced significant intraday swings, testing both upper and lower bounds before settling near recent support levels.
1-Hour Support/Resistance and Candlestick Patterns
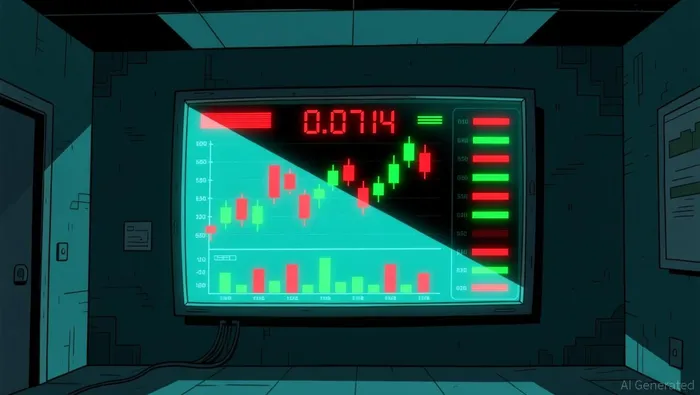
Price action reveals distinct resistance and support zones marked by multiple rejections. A clear resistance level emerged around 0.0714, where the asset faced strong selling pressure, evidenced by a long upper shadow in the candle closing at 06:00 UTC on September 2, 2026. Another notable rejection occurred near 0.0686, where the price failed to sustain momentum, resulting in a bearish engulfing pattern at 22:00 UTC on September 1, 2026. On the support side, the level near 0.0627 acted as a floor, with the price bouncing from this area during the 02:00 UTC candle. Additionally, a long lower shadow at 14:00 UTC on September 1, 2026, confirmed support near 0.0557, although the current price is significantly above this historical low. The current price of 0.0634 is closer to the immediate support at 0.0627 than to the nearest resistance at 0.0686, suggesting a neutral to slightly bearish bias in the short term. The presence of doji candles at 00:00 and 01:00 UTC on September 2 indicates indecision, which could precede a directional move.
Volume and Turnover vs. Historical Comparison
The 24-hour total volume of approximately 13.5 million USDT is lower than the 7-day average daily volume of approximately 6.57 million USDT, suggesting a decrease in overall trading activity compared to the recent week. However, specific hourly volumes show significant spikes. The hour at 20:00 UTC on September 1 recorded a volume of 2.6 million USDT, which is substantially higher than the 7-day average single-hour volume of approximately 273,737 USDT. This spike was accompanied by a price increase of approximately 15.5% within the hour, indicating strong buying pressure. Similarly, the hour at 06:00 UTC on September 2 saw a volume of 1.98 million USDT, with a price increase of approximately 3.9%, showing continued interest. The hour at 07:00 UTC on September 2 recorded a volume of 2.16 million USDT, with a price increase of approximately 5.6%, further confirming upward momentum. However, the subsequent hours at 08:00 and 09:00 UTC showed declining volumes and price stabilization, suggesting that the initial volume spikes did not sustain a prolonged uptrend. The high volume at 20:00 UTC on September 1 was followed by a price drop, indicating that the buying pressure was not sufficient to maintain higher prices. Overall, the volume anomalies appear to have driven short-term price movements, but the lack of sustained follow-through suggests caution is warranted.
Look Back: Current Market Phase
Analyzing the 7-15 day market structure reveals a complex picture. The recent 7-day price change is approximately 12.93%, indicating a significant upward move. However, the 3-day price change is approximately 2.62%, suggesting a slowdown in momentum. The market structure feature is described as a "higher high," which typically indicates an uptrend. However, the recent price action shows a series of lower highs and lower lows in the immediate 24-hour period, suggesting a potential mean reversion or correction phase. The significant price drop from 0.06735 to 0.06187 between 21:00 UTC on September 1 and 23:00 UTC on September 1, followed by a recovery, indicates volatility within the broader uptrend. Given the sharp recent moves and the current consolidation, the market appears to be in a mean reversion phase, potentially correcting the previous gains. This phase is characterized by a lack of clear directional momentum and increased volatility, which could lead to further price fluctuations in the near term.
The next 24 hours will likely see continued volatility as the market tests key support and resistance levels. A break below 0.0627 could lead to further downside towards 0.0600, while a sustained move above 0.0686 may signal a resumption of the uptrend. Traders should exercise caution and monitor volume and price action closely for confirmation of directional bias.

Decoding market patterns and unlocking profitable trading strategies in the crypto space
Latest Articles
Stay ahead of the market.
Get curated U.S. market news, insights and key dates delivered to your inbox.


AInvest
PRO
AInvest
PRO




Comments
No comments yet