
LABUSDT Dips to 0.067 — Low Volume Blocks Breakout
 Aime Summary
Summary
- LABUSDT trades near support after failing to break resistance, showing indecision in recent candles.
- Volume remains below 7-day average, indicating weak conviction behind current price movements.
- Market structure shows lower lows, suggesting a continued downtrend phase over the past week.
- Key resistance at 0.070 holds firm, while support at 0.066 provides temporary floor.
- Caution advised as lack of volume follow-through limits upside potential in near term.
Range Bound with Downside Bias
LAB/Tether (LABUSDT) closed the latest hour at 0.06721, with 24-hour total volume reaching 13,535,000 USDT. The asset exhibits low volatility against a backdrop of declining volume trends, reflecting cautious investor sentiment in the current market phase.
1-Hour Support/Resistance and Candlestick Patterns
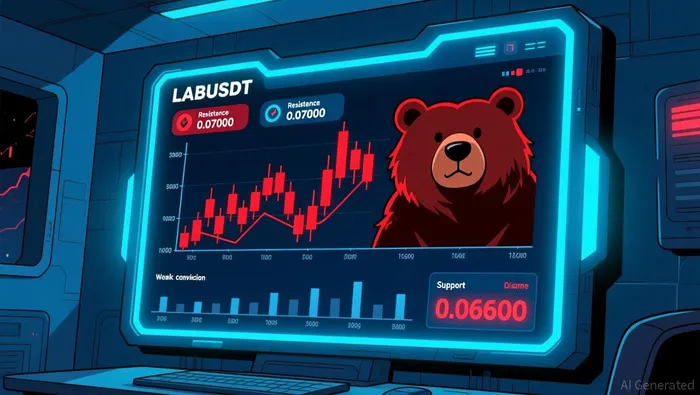
Price action has repeatedly rejected the 0.07000 area, establishing it as a strong resistance zone where sellers consistently stepped in. Conversely, the 0.06600 level has acted as dynamic support, with multiple attempts to break below failing to sustain momentum. Recent hourly candles display a mix of long lower shadows and doji formations, particularly between 01:00 and 03:00 on September 13, indicating significant indecision and equal pressure between buyers and sellers. The presence of bullish engulfing patterns at 19:00 on September 12 and 08:00 on September 13 was quickly negated by subsequent bearish engulfing candles, suggesting that any upward moves are being sold into. Currently, the price appears closer to the immediate support level of 0.06600 than the resistance at 0.07000, highlighting a slight bearish lean in the short-term structure.
Volume and Turnover vs. Historical Comparison
The 24-hour total volume of approximately 13.5 million USDT is significantly lower than the 7-day average daily volume of 20.9 million USDT and the 15-day average of 12.6 million USDT. While the daily total is slightly above the 15-day average, the hourly distribution reveals a lack of sustained interest. The highest single-hour volume occurred at 12:00 on September 13 with roughly 1.44 million USDT, which is only marginally higher than the 7-day average hourly volume of 870,000 USDT. Notably, the volume spike at 00:00 on September 13, which saw a price increase from 0.06429 to 0.06944, was not followed by continued buying pressure in the subsequent hours. Instead, the price drifted lower, indicating that the volume anomaly did not drive a sustainable trend change. This suggests that current volume levels are insufficient to support a significant breakout, and any rallies may lack the necessary participation to sustain higher prices.
Look Back: Current Market Phase
Over the past 7 to 15 days, LABUSDT has formed a series of lower highs and lower lows, with a 7-day price decline of nearly 3% and a 3-day decline of over 6%. The market structure feature is explicitly identified as "lower low," confirming a downtrend. The 15-day daily price range is narrow at 0.05, but the directional bias remains downward. This pattern aligns with a continuation of the existing downtrend rather than a mean reversion or sideways consolidation, as the price has not shown strong signs of reversing the prior move. The market appears to be in a corrective phase, with sellers maintaining control over the overall structure.
Looking ahead, LABUSDT may continue to testTST-- lower support levels if the 0.06600 support breaks, potentially exposing downside risk toward 0.06400. Conversely, a sustained move above 0.07000 with increased volume could signal a short-term reversal, but the current lack of volume suggests such a move is unlikely without significant external catalysts.

Decoding market patterns and unlocking profitable trading strategies in the crypto space
Latest Articles
Stay ahead of the market.
Get curated U.S. market news, insights and key dates delivered to your inbox.


AInvest
PRO
AInvest
PRO




Comments
No comments yet