
Kyndryl Holdings's 15min chart shows MACD Death Cross, Bollinger Bands Narrowing.
ByAinvest
Friday, Feb 6, 2026 2:32 pm ET1min read
KD--
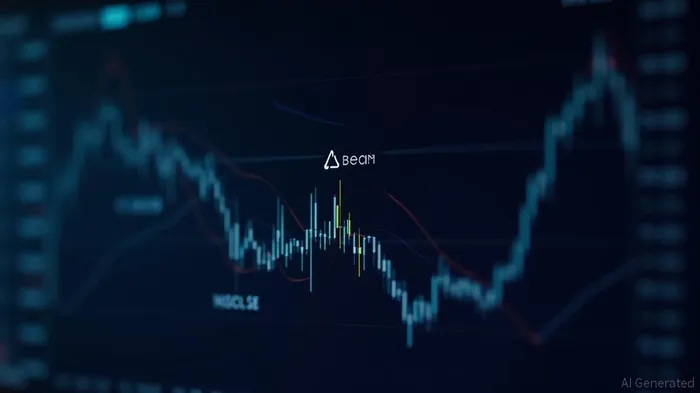
According to the 15-minute chart for Kyndryl Holdings, a technical analysis indicator known as the MACD Death Cross has been triggered, accompanied by narrowing Bollinger Bands. This suggests that there is a high likelihood of a continued decline in the stock price, with a reduced magnitude of price fluctuations. The MACD Death Cross is a bearish signal that indicates a trend reversal, while the narrowing Bollinger Bands suggest that the stock price is becoming less volatile. These technical indicators together point to a potential downward trend for Kyndryl Holdings.
Stay ahead of the market.
Get curated U.S. market news, insights and key dates delivered to your inbox.
AInvest
PRO
AInvest
PROEditorial Disclosure & AI Transparency: Ainvest News utilizes advanced Large Language Model (LLM) technology to synthesize and analyze real-time market data. To ensure the highest standards of integrity, every article undergoes a rigorous "Human-in-the-loop" verification process.
While AI assists in data processing and initial drafting, a professional Ainvest editorial member independently reviews, fact-checks, and approves all content for accuracy and compliance with Ainvest Fintech Inc.’s editorial standards. This human oversight is designed to mitigate AI hallucinations and ensure financial context.
Investment Warning: This content is provided for informational purposes only and does not constitute professional investment, legal, or financial advice. Markets involve inherent risks. Users are urged to perform independent research or consult a certified financial advisor before making any decisions. Ainvest Fintech Inc. disclaims all liability for actions taken based on this information. Found an error?Report an Issue

ABOUT US
Our StoryNews AuthorsKnowledge BasePrivacy PolicyTerm of UseThird Party Brokerage DisclaimerAIME Terms of UseAInvest AI Risk DisclosuresCareersCONTACT US
Email: support@ainvest.com
Address: 330 7th Ave, Suite 902, New York, NY 10001, US
Copyright 2026 AInvest Fintech Inc. All rights reserved.
Comments
No comments yet