
Klarna (KLAR) Surges 6.21% in Session Two-Day Gain Hits 8.26% as Technical Indicators Signal Bullish Reversal
Klarna (KLAR) has surged 6.21% in the most recent session, marking two consecutive days of gains with a cumulative increase of 8.26% over the past two days. This sharp upward movement follows a volatile period, including a significant 4.54% decline on 2025-12-01, suggesting potential short-term momentum. The analysis below explores technical indicators to assess the stock’s current positioning and potential future direction.
Candlestick Theory
Recent candlestick patterns indicate a potential bullish reversal. The 12-01 session saw a sharp bearish candle (4.54% decline), followed by a strong bullish candle (6.21%) on 12-04, forming a bullish engulfing pattern. This suggests a shift in sentiment from bearish to bullish. Key support levels appear to be forming around $30.00 (12-03 low) and $29.90 (12-01 low), while resistance is evident at $32.87 (12-04 high). A break above $32.87 could target the next psychological level at $35.00, aligning with historical resistance from late October.
Moving Average Theory
Short-term and long-term trends diverge slightly. The 50-day moving average (calculated from historical data) is currently below the 100-day and 200-day averages, indicating a bearish intermediate trend. However, the recent price surge has brought the current closing price ($32.5) closer to the 50-day MA, suggesting a potential short-term upward correction. If the 50-day MA crosses above the 100-day MA in the coming weeks, it could signal a bullish trend reversal. The 200-day MA remains a critical benchmark; sustained above this level would reinforce long-term bullish momentum.
MACD & KDJ Indicators 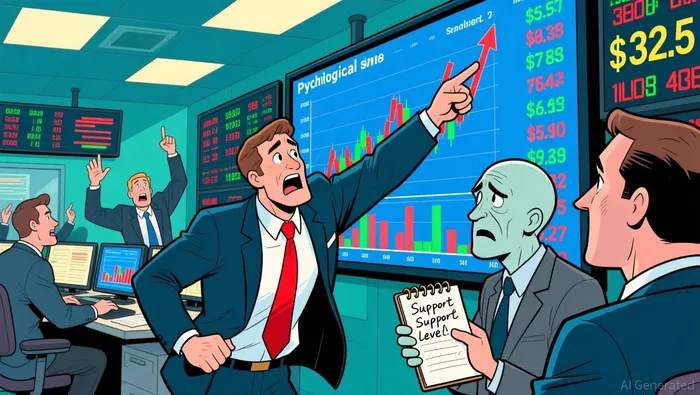 The MACD histogram has shown a narrowing bearish divergence after the 12-01 decline, with the line crossing above the signal line on 12-04, indicating potential bullish momentum. The KDJ (stochastic oscillator) suggests overbought conditions, with %K and %D converging above 80 in recent sessions. While this may signal a near-term pullback, the alignment of MACD and KDJ divergence suggests that any correction could be shallow, with a high probability of resuming the upward trend if the 12-04 high ($32.87) holds.
Bollinger Bands
Volatility has increased sharply, as evidenced by the expansion of Bollinger Bands following the 12-01 selloff. The current price ($32.5) is approaching the upper band, indicating overbought territory. This confluence with the RSI and KDJ overbought signals suggests a high probability of a retracement to the middle band ($30.6–$31.00 range). A break below the lower band would signal renewed bearish momentum, but the recent bullish engulfing pattern implies such a move is less likely without a breakdown of key support levels.
Volume-Price Relationship
Trading volume has spiked in recent sessions, particularly on 12-04 (3.19 million shares) and 12-03 (1.42 million shares), validating the price surge. This volume surge aligns with the bullish engulfing pattern, reinforcing the likelihood of a sustained upward move. However, if volume declines in subsequent sessions while the price remains above $32.00, it could indicate waning momentum. The volume spike on 12-01 (2.66 million shares) during the 4.54% drop also highlights bearish conviction, creating a divergence that suggests the recent rally may lack broad-based demand.
Relative Strength Index (RSI)
The 14-day RSI has surged to 72, entering overbought territory. While this typically signals a potential pullback, the recent volume surge and bullish candlestick patterns suggest that the overbought condition may persist for several sessions. A drop below 60 would indicate weakening momentum, but a sustained close above 70 would confirm a strong bullish bias. The RSI’s alignment with Bollinger Bands and MACD divergence highlights a high-probability scenario of a short-term correction to the 60–65 RSI range before resuming the upward trend.
Fibonacci Retracement
Key Fibonacci levels derived from the October 9 high ($57.20) and November 18 low ($31.22) are critical. The 61.8% retracement level is at $43.00, while the 38.2% level is at $45.00. The current price ($32.5) is below the 50% retracement level ($44.21), suggesting that the recent rally could be part of a larger consolidation phase. A breakout above $45.00 would target the 61.8% level, but a failure to hold above $32.00 could see the price retest the 23.6% retracement level ($46.00).
In conclusion, Klarna’s recent price action suggests a high-probability bullish scenario in the short term, supported by confluence among candlestick patterns, MACD, and volume-volume relationships. However, overbought indicators (RSI, KDJ) and potential volatility expansion in Bollinger Bands imply caution for extended short-term gains. Divergences in volume and intermediate moving averages warrant monitoring for signs of weakening momentum.
If I have seen further, it is by standing on the shoulders of giants.
Latest Articles
Stay ahead of the market.
Get curated U.S. market news, insights and key dates delivered to your inbox.
AInvest
PRO
AInvest
PRO
Comments
No comments yet