
Klarna (KLAR) Plunges 4.38% as Bearish Technical Signals Intensify Near Key Support Levels
Klarna (KLAR) fell 4.38% in the most recent session, with the price hovering near key support levels identified through candlestick analysis. The recent bearish reversal patterns, such as the engulfing and dark cloud cover, suggest a potential continuation of the downward trend. Key support levels are forming around $29.45–$30.00, reinforced by multiple price tests in late December, while resistance clusters near $31.00–$32.50 have repeatedly failed to hold. Candlestick Theory indicates that the current price action aligns with a bearish bias, though a decisive break above $31.10 (December 12 high) could invalidate the short-term downtrend. 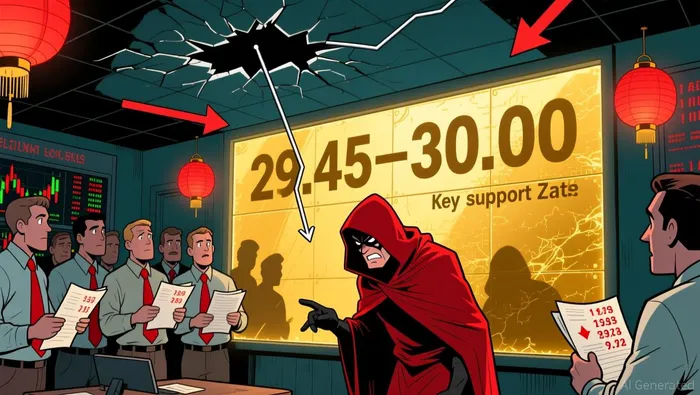 Moving Average Theory reveals KLARKLAR-- trading below its 50-day ($33.00), 100-day ($34.50), and 200-day ($36.00) moving averages, confirming a bearish medium-term bias. The 50-day MA crossing below the 100-day MA in early December created a death cross, amplifying the bearish signal. Short-term momentum remains weak, with the 50-day MA likely to drift lower unless the price reclaims $32.50. The confluence of all three moving averages sloping downward suggests a high probability of further consolidation below $30.00 unless a strong reversal occurs.
MACD & KDJ Indicators show diverging signals. The MACD histogram has turned negative and remains below the zero line, reflecting sustained bearish momentum, while the KDJ (Stochastic) oscillator is in oversold territory (<20), hinting at potential short-term bounce. However, the MACD’s bearish divergence with price—where the indicator fails to make lower lows despite declining prices—suggests the downtrend could persist. The KDJ’s oversold condition may attract technical buyers but lacks conviction due to the broader bearish context.
Bollinger Bands demonstrate a contraction phase in mid-December, signaling low volatility and a potential breakout. The price currently sits near the lower band ($29.45), reinforcing oversold conditions. A breakout above the upper band ($31.00–$31.10) would require a sharp reversal, while a breakdown below the lower band would confirm a new bearish phase. The bands’ width has widened recently, indicating rising volatility, which aligns with the recent 4.38% drop.
Volume-Price Relationship highlights mixed signals. The recent sharp decline on 12/17 saw elevated volume (2.5M shares), validating the bearish move, but subsequent sessions (12/16–12/15) show declining volume during minor rallies, suggesting weak follow-through. This pattern implies the downtrend may lack immediate buying interest to reverse, though a surge in volume during a rebound could signal a short-term bottom.
Relative Strength Index (RSI) confirms oversold conditions at 28, but the indicator has lingered in this range for weeks, reducing its predictive power. A sustained close above 40 would be required to confirm a reversal, while further declines below 20 may trigger algorithmic buying. The RSI’s divergence with price—lower highs in price without corresponding RSI lows—suggests exhaustion in the downtrend, but this remains probabilistic rather than deterministic.
Fibonacci Retracement levels drawn from the October 27 high ($39.73) to the December 17 low ($29.45) highlight critical zones. The 61.8% retracement level at $31.00 has acted as a dynamic resistance, while the 50% level ($34.60) is far removed from current price action. A breakdown below the 38.2% level ($29.45) would target $28.11 (78.6% retracement), but this requires a continuation of the bearish momentum observed in mid-December.
The confluence of bearish signals from candlestick patterns, moving averages, and MACD, combined with the RSI in oversold territory and Bollinger Bands contraction, suggests a high probability of continued downward pressure. However, the KDJ’s oversold reading and Fibonacci support at $30.00–$31.00 may attract short-term buyers. Divergences between volume and price, as well as the RSI’s lack of strong reversal signals, indicate caution is warranted. Traders should monitor the 50-day MA as a dynamic support threshold and watch for a break below $29.45 to validate the next leg down.
If I have seen further, it is by standing on the shoulders of giants.
Latest Articles
Stay ahead of the market.
Get curated U.S. market news, insights and key dates delivered to your inbox.
AInvest
PRO
AInvest
PRO
Comments
No comments yet