
Keysight Drops 3.37% As Bearish Engulfing Pattern Signals Rally Exhaustion
Generated by AI AgentAinvest Technical Radar
Thursday, Aug 14, 2025 6:50 pm ET2min read
KEYS-- Aime Summary
Keysight (KEYS) declined 3.37% in the most recent session (2025-08-14), closing at 164.48 after trading between 162.72 and 168.525. This analysis evaluates KEYS’ technical posture through multiple frameworks, using historical price data to simulate indicators and identify key patterns.
Candlestick Theory
The recent candlestick pattern reveals a sharp reversal signal. On 2025-08-13, KEYS formed a robust bullish candle (170.22 close, +1.87%), followed by a bearish engulfing candle on 2025-08-14, closing at 164.48 (-3.37%) on increased selling pressure. This pattern suggests near-term exhaustion after the rally from the 156.13 low (2025-08-01). Resistance is firmly established at 170.50–170.55, aligning with the August 2025 highs, while immediate support rests at 162.70–162.75 (recent intraday low). A breach below 162.70 may expose the psychological 160.00–160.50 support zone, historically defended in July–August 2025.
Moving Average Theory
Moving averages (MA) highlight shifting momentum. The 50-day MA (approximately 167.00) has turned downward, and the price has closed below it, signaling short-term bearish pressure. However, the 100-day MA (near 161.00) and 200-day MA (around 155.00) remain upward-sloping, reflecting a resilient longer-term uptrend. The current price (164.48) hovering above the 100-day MA suggests this level may act as dynamic support. A sustained break below the 100-day MA would undermine the intermediate trend, potentially accelerating selling toward the 200-day MA.
MACD & KDJ Indicators
The MACD histogram has crossed below its signal line into negative territory, confirming weakening bullish momentum. Concurrently, the KDJ oscillator (using a 9-day period) shows %K (23) and %D (35) plunging toward oversold thresholds. This divergence—MACD’s bearish signal against KDJ’s near-oversold reading—indicates conflicting forces. While the MACD supports further downside, the KDJ nearing oversold territory may precede a short-term rebound if buyers step in at key supports (e.g., 162.70).
BollingerBINI-- Bands
Bollinger Bands (20-day, 2SD) are contracting after recent volatility, suggesting diminished directional conviction. Price action is testing the lower band (near 163.00), typically a potential reversal zone. However, a close below the lower band would indicate escalating selling pressure, potentially widening the bands and signaling a breakdown. The convergence of the lower band with the 162.70 support strengthens this level’s technical significance; holding it may trigger a bounce toward the 20-day midline (~166.50).
Volume-Price Relationship
Volume trends validate bearish near-term sentiment. The 3.37% drop on 2025-08-14 occurred on 841.7K shares traded—moderate but above the 30-day average—indicating conviction behind the selloff. Prior rallies (e.g., 2025-08-12’s +3.47% on 857.8K shares) saw stronger volume, underscoring buyer exhaustion. Declining volume during minor rebounds (e.g., 2025-08-08’s +2.30% on 715.6K shares) further suggests tepid demand. A reversal would require significantly higher volume to confirm new buying interest.
Relative Strength Index (RSI)
The 14-day RSI (approximately 41) has retreated from neutral (50–60) toward the edge of oversold territory. While not yet at 30, its trajectory implies growing downside momentum. Notably, RSI failed to reach overbought (>70) during the August rally, reflecting underlying weakness. A break below 35 would likely signal oversold conditions, but RSI’s tendency to diverge from price during KEYS’ volatile phases warrants caution—momentum could deteriorate further without immediate reversal.
Fibonacci Retracement
Applying Fibonacci to the upswing from 156.13 (2025-08-01) to 170.54 (2025-08-13) identifies critical retracement levels: 163.33 (38.2%), 161.63 (50.0%), and 159.92 (61.8%). The current price (164.48) hovers just below the 38.2% level, which may now act as resistance. A slide to the 50–61.8% zone (159.92–161.63) appears probable, aligning with historical support from July–August 2025. This area is a high-confluence support, combining Fibonacci, MA (100-day), and prior swing lows.
Confluence & Divergence
A critical confluence exists at 161.60–162.70, combining Fibonacci (50% retracement), horizontal support, and the 100-day MA. This zone could attract buyers if tested. Notable divergences arise between oscillators: the KDJ’s oversold signal conflicts with MACD’s bearish crossover, reflecting uncertainty. Meanwhile, declining volume on rebounds versus selling pressure reinforces near-term bearishness. KEYS may consolidate near supports (160–163) before stabilizing; a decisive close below 160.00 would imply an extended correction toward 155.00.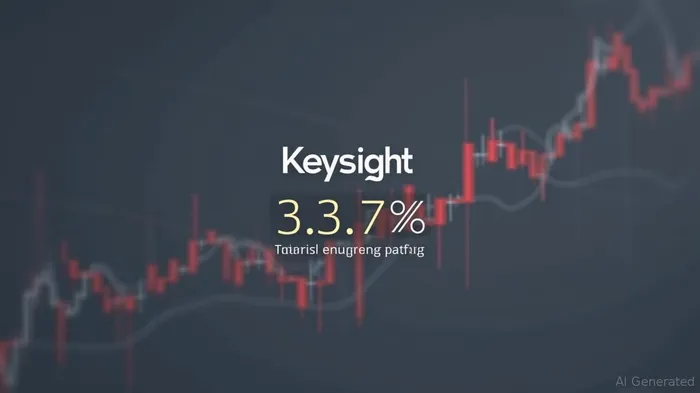
If I have seen further, it is by standing on the shoulders of giants.
Latest Articles
Stay ahead of the market.
Get curated U.S. market news, insights and key dates delivered to your inbox.
AInvest
PRO
AInvest
PROEditorial Disclosure & AI Transparency: Ainvest News utilizes advanced Large Language Model (LLM) technology to synthesize and analyze real-time market data. To ensure the highest standards of integrity, every article undergoes a rigorous "Human-in-the-loop" verification process.
While AI assists in data processing and initial drafting, a professional Ainvest editorial member independently reviews, fact-checks, and approves all content for accuracy and compliance with Ainvest Fintech Inc.’s editorial standards. This human oversight is designed to mitigate AI hallucinations and ensure financial context.
Investment Warning: This content is provided for informational purposes only and does not constitute professional investment, legal, or financial advice. Markets involve inherent risks. Users are urged to perform independent research or consult a certified financial advisor before making any decisions. Ainvest Fintech Inc. disclaims all liability for actions taken based on this information. Found an error?Report an Issue

ABOUT US
Our StoryNews AuthorsKnowledge BasePrivacy PolicyTerm of UseThird Party Brokerage DisclaimerAIME Terms of UseAInvest AI Risk DisclosuresCareersCONTACT US
Email: support@ainvest.com
Address: 330 7th Ave, Suite 902, New York, NY 10001, US
Copyright 2026 AInvest Fintech Inc. All rights reserved.
Comments
No comments yet