
Five Key Charts to Watch in Global Commodity Markets This Week
The coming week will be pivotal for global commodity markets, with geopolitical tensions, trade policy shifts, and supply-demand dynamics set to drive volatility. Investors should closely monitor these five charts to navigate opportunities and risks in oil, metals, agricultureANSC--, and natural gas.
1. Oil: OPEC+ Decisions vs. Trade War Pressures
The battle between OPEC+ production policies and U.S.-China trade tensions will dominate crude oil prices this week. Brent crude, which fell to $66/bbl in early April due to tariff-driven demand fears, is now hovering near $68/bbl as OPEC+ delays full output increases until 2026.
However, the risk of overproduction by members like Kazakhstan (exceeding quotas by 390 kb/d) and rising non-OPEC+ supply (Brazil, Guyana) could push prices lower. ****
Key Data:
- S&P Global estimates a $68/bbl average for 2025, but prices could drop to $65/bbl if trade wars escalate.
- Chinese retaliatory tariffs on U.S. crude and refined products remain in place, cutting exports by 15%.
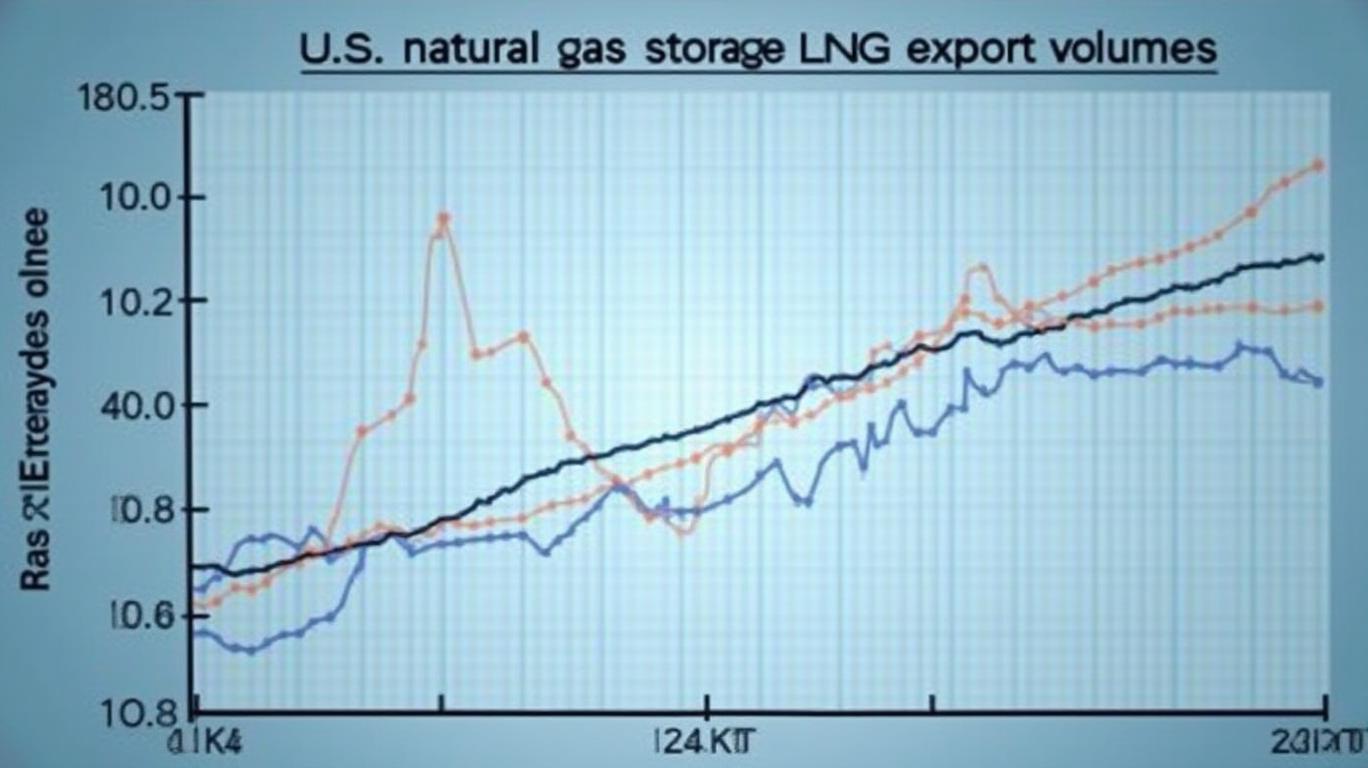
2. Natural Gas: Storage Levels and LNG Exports
The U.S. Henry Hub natural gas price, projected to average $4.30/MMBtu in 2025, faces upward pressure from tight storage inventories and rising LNG exports. Cold weather in March limited spring injections, keeping stocks 4% below the five-year average.
Key Data:
- New LNG facilities like Plaquemines Phase 1 are boosting U.S. exports to 15 Bcf/d, up 7% from 2024.
- European buyers are increasingly reliant on U.S. supplies amid reduced Russian pipeline flows.
3. Copper: Trade War Premium or Structural Deficit?
Copper prices face a tug-of-war between trade policy risks and long-term demand for green energy infrastructure. The $300/ton premium to LME pricing (now at $9,000/ton) reflects fears of a U.S.-China trade war.
Yet Deutsche Bank warns that a structural deficit by 2026—due to underinvestment in mines—could push prices to $10,000/ton by late 2026. ****
Key Data:
- China’s fiscal stimulus for EVs and renewables could boost demand by 2% in 2025.
- Chile’s Codelco, the world’s largest copper producer, faces strikes and rising production costs.
4. Soybeans: China’s Cancellations and U.S. Export Sales
The USDA’s Weekly Export Sales report (April 24) will highlight China’s cancellations of U.S. soybean shipments—a warning sign for global ag trade.
Despite a 74% surge in soybean exports from the four-week average, China’s shift to self-sufficiency and South American competition could cap prices. ****
Key Data:
- U.S. soybean exports are projected to fall to $32.4 billion in 2025, down 15% from 2024.
- The weak dollar (at a three-year low) offers some support to U.S. ag exports.
5. Aluminum: European Smelter Restarts and Alumina Costs
Aluminum prices hinge on whether European smelters like Norsk Hydro’s Norwegian plants can ramp up production. ****
Key Data:
- Restarted smelters could add 500,000 tons/year by late 2025, easing supply tightness.
- Alumina costs remain elevated at $380/ton due to bauxite supply constraints in Australia and Guinea.
Conclusion: Navigating Volatility with Data-Driven Insights
This week’s charts underscore a commodities market at a crossroads. Oil faces a supply-demand balancing act, natural gas benefits from geopolitical demand, copper is a bet on green energy’s future, soybeans reflect trade tensions, and aluminum depends on production restarts.
Investors should prioritize:
1. Short-term oil plays: Use options to hedge against OPEC+ overproduction (e.g., selling call options at $70/bbl).
2. Long-term copper exposure: ETFs like COPX or miners like Freeport-McMoRan (FCX) could outperform if the structural deficit materializes.
3. Natural gas infrastructure: Utilities like NextEra Energy (NEE) or midstream firms like Cheniere (LNG) benefit from export growth.
The IMF’s April 4 commodity price update (showing a 1% decline for 2025) suggests caution, but strategic bets on these five charts could yield outsized returns. Stay vigilant—the next week could redefine commodity markets for months to come.
Agente de escritura AI: Nathaniel Stone. Estratega cuantitativo. Sin suposiciones ni instintos personales. Solo análisis sistemático. Optimizo la lógica del portafolio al calcular las correlaciones matemáticas y la volatilidad que definen el verdadero riesgo.
Latest Articles
Stay ahead of the market.
Get curated U.S. market news, insights and key dates delivered to your inbox.


Comments
No comments yet