
Kaspa Price Holds Above 9-Day SMA With 0.42% Gain
Kaspa (KAS) is currently trading at $0.07409, marking a 0.05% increase over the past day. The cryptocurrency has managed to climb back above its 9-day moving average earlier this week, which is a positive sign. However, the momentum has not followed through, and the price action appears cautious. Most indicators suggest that the market is still determining its next move.
After reaching a low of $0.062 on June 22, KAS experienced a strong bounce. However, over the past few days, the price movements have been small and uncertain, with sellers stepping in at higher levels. The current price is hovering just above short-term support, indicating a period of consolidation.
Yesterday's prediction highlighted the importance of the $0.073 level. If this level were to break, a potential drop toward $0.067 or even $0.060 could occur. So far, $0.073 has held, and the price remains within the $0.072 to $0.075 range, exhibiting the expected sideways action. Bulls have not pushed through resistance, and bears have not taken control, resulting in a stalemate.
KAS is currently trading at $0.0738, reflecting a 0.42% increase over the past 24 hours. The 9-day simple moving average (SMA) stands at $0.0711, and the volume remains flat and unconvincing. The price is sitting above the 9-day SMA, which is a short-term win for the bulls. However, the candles show hesitation, and traders are not pushing in either direction. Key resistance is near $0.078–$0.080, while support remains around $0.071.
The Kaspa chart indicates that the price is still stuck in a broader downtrend that has been in place since May. The big green candle from June 24 looked promising, but the subsequent sessions did not build on it. Currently, KAS is drifting above the moving average, awaiting a clear signal. Unless there is a clean breakout above $0.078, the sideways pattern is likely to continue.
Technical indicators on the daily timeframe show a mixed picture. The MACD (12,26) is bearish but very weak, while the ADX (14) suggests that a trend might be forming. The CCI (14) indicates no strong momentum, and the Ultimate Oscillator shows that bears still have some control. The ROC indicates slight bullish momentum, and the Bull/Bear Power (13) shows that bulls have a tiny advantage. Overall, the indicator mix remains neutral with a slight bullish bias, but nothing is confirmed yet, typical of a market stuck in limbo.
Looking ahead, if KAS breaks and closes above $0.078, it could climb toward $0.085 or even $0.090. If the price stays between $0.071 and $0.075, expect more sideways movement until something shifts. On the bearish side, if the price drops below $0.071 and then $0.067, it could head back to the $0.060 zone.
In conclusion, Kaspa price is holding its ground above the 9-day SMA, which is a decent sign. However, without stronger buying, it is just drifting. The most likely outcome is continued sideways movement between $0.071 and $0.075. A clean move outside this range will set the tone for what's next. 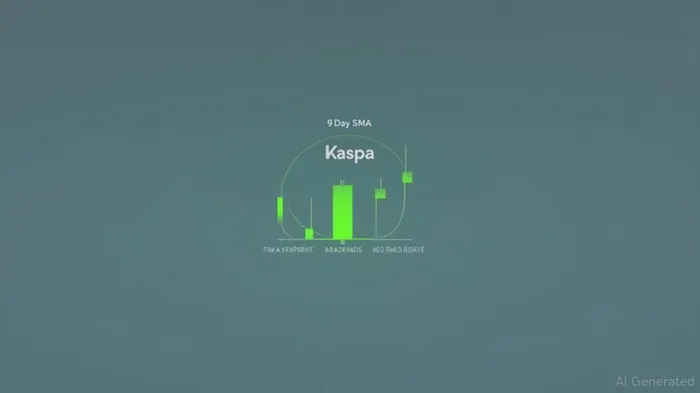
Stay ahead of the market.
Get curated U.S. market news, insights and key dates delivered to your inbox.


AInvest
PRO
AInvest
PRO
Comments
No comments yet