
Kaixin (KXIN.O) Sharp Intraday Drop: A Technical and Market Flow Deep Dive
1. Technical Signal Analysis: What the Charts Say
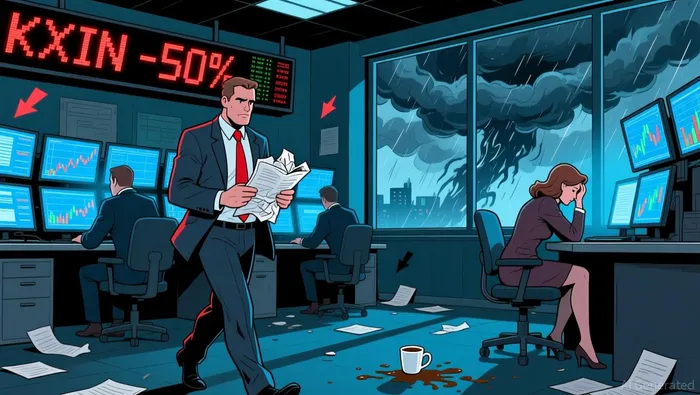
Kaixin (KXIN.O) plummeted by 13.61% in intraday trading, despite the absence of any significant fundamental news. A scan of today's technical signals shows that most traditional reversal and continuation patterns did not trigger. Patterns like the head-and-shoulders, double top, and double bottom remained dormant, indicating no clear sign of a trend reversal or continuation through classic candlestick setups.
However, one key signal did fire: RSI (Relative Strength Index) oversold. This typically suggests that a stock has dropped sharply and may be due for a bounce or at least a pullback. The fact that it hit an oversold condition raises questions: if the RSI is indicating extreme weakness, why has the sell-off continued instead of reversing? This could point to aggressive profit-taking, panic selling, or a shift in market sentiment that is not yet reflected in broader technical indicators.
2. Order-Flow Breakdown: No Block Trading, But Volume Told a Story
While there was no block trading data or major bid/ask imbalances to report, the trading volume was notably high at 2.3 million shares — a significant volume spike for a stock with a market cap of just over $4.7 million. High volume during a sharp price drop usually indicates that large orders or institutional selling might be involved. However, the absence of block trades suggests that this might be retail-driven selling or algorithmic liquidation rather than a large institutional exit.
The lack of bid support or visible accumulation zones also hints at a lack of buyers stepping in during the decline, reinforcing the idea that this could be a liquidity-driven sell-off.
3. Peer Comparison: Divergence in the Theme Group
Kaixin operates in a sector that includes several high-profile tech and emerging market names. While most of these stocks were in positive territory — for example, AAPL was up 6.59%, AXL up 5.74%, and ADNT up 5.9% — KaixinKXIN-- was the only one in the group to fall sharply. This divergence is crucial. It indicates that the move is not part of a broader sector rotation or macro event, but rather a stock-specific issue.
Other smaller or less liquid names, like ATXG and AACG, also saw modest declines, but nothing close to the 13.6% drop in Kaixin. This further suggests that Kaixin was hit by internal or liquidity factors, possibly triggered by a sudden loss of confidence, a short squeeze, or an algorithmic trading event.
4. Hypothesis Formation: Why the Drop?
Based on the technical and flow data, the most plausible explanations for Kaixin’s sharp drop are:
Short-term algorithmic selling or retail panic: The high volume with no block trades points toward a liquidity-driven event, likely fueled by a sudden shift in sentiment. Given the RSI oversold signal, it’s possible the drop was a sharp reaction to a negative news hint (even if unreported), triggering sell algorithms and panic orders.
Lack of buyer participation: The absence of a bid wall or accumulation suggests that no major buyers stepped in to absorb the selling pressure. This could indicate a loss of institutional or large investor confidence, or the presence of short sellers aggressively betting on further weakness.
5. Summary and Outlook
Kaixin (KXIN.O) experienced a brutal 13.6% intraday drop without any clear fundamental catalyst. Technically, the stock hit an RSI oversold level, suggesting a potential rebound. However, the high volume with no block trades and the absence of bid support point toward a liquidity-driven move — possibly a short-term algorithmic sell-off or a panic reaction.
The divergence from its theme group further points to a stock-specific issue, rather than a sector-wide move. While the RSI condition could signal a short-term bounce, the lack of follow-through buying remains a red flag. Traders should monitor Kaixin closely for signs of reversal or continued selling pressure, particularly if the RSI fails to recover in the next few sessions.
Stay ahead of the market.
Get curated U.S. market news, insights and key dates delivered to your inbox.

Comments
No comments yet