
JPMorgan Defies Tariff Gloom with Strong Q1 Beat, Reinforces Fortress Balance Sheet
JPMorgan Chase delivered better-than-feared Q1 2025 results that helped reverse a steep selloff in its shares, with the stock rebounding in premarket trading following the release. The stock had dropped from around $275 to $210 amid growing recession fears linked to escalating tariffs, but JPM’s results painted a more resilient picture. CEO Jamie Dimon acknowledged macroeconomic turbulence, echoing comments from his recent shareholder letter, yet the firm’s earnings, loan performance, and capital strength suggest it remains on firm footing.
Earnings and Revenue Beat Expectations
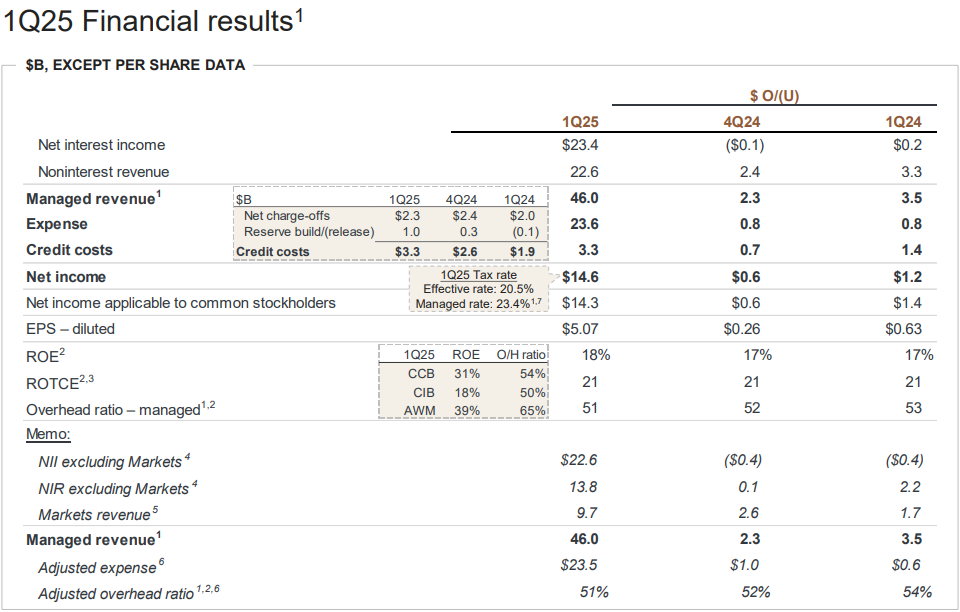
JPM reported earnings per share of $5.07, ahead of the $4.63 FactSetFDS-- consensus, on net income of $14.6 billion. Revenue came in at $45.3 billion, surpassing expectations of $43.9 billion. Adjusted managed revenue totaled $46.01 billion, buoyed by strong equity trading and firm-wide fee growth. The return on equity (RoE) was a robust 18%, while return on tangible common equity (RoTCE) hit 21%, both topping Street forecasts.
Credit Costs and Reserve Build: Playing Defense
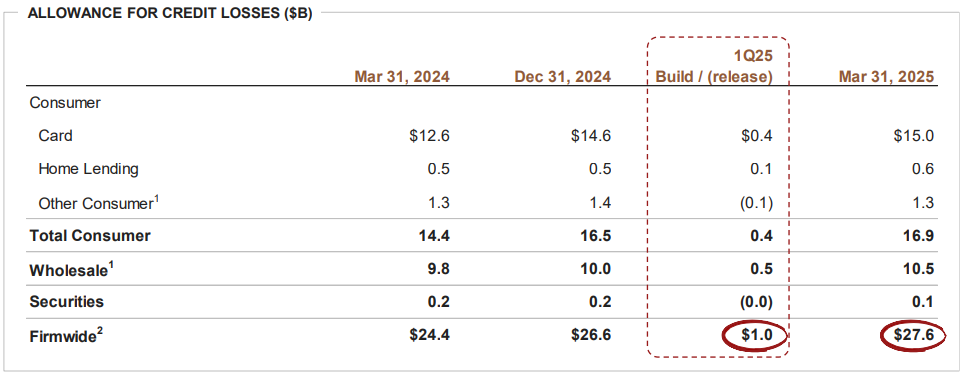
The firm booked $3.3 billion in credit costs, well above the expected $2.7 billion. That figure included $2.3 billion in net charge-offs and a $973 million reserve build. The reserve increase was largely tied to a more cautious macroeconomic outlook, particularly in the face of global volatility, sticky inflation, and tariff risks. JPM's total allowance for credit losses rose $1.0 billion quarter-over-quarter to $27.6 billion. Of that, $475 million came from the consumer segment, notably card services, and $528 million from wholesale exposures.
The firm’s famed “fortress balance sheet” remains a pillar of strength. Dimon emphasized the importance of excess capital and liquidity in uncertain times, calling it “prudent” to maintain such cushions. JPM’s capital ratios remain well above regulatory minimums, enabling both defense and offense as conditions evolve.
Net Interest Income and Expense Trends
Net interest income excluding Markets was $22.6 billion, down 2% from the prior year, reflecting lower rates and margin compression. However, this was offset by higher revolving balances in card services and gains from securities activities. Overall managed NII was reaffirmed at $94.5 billion for the year.
Noninterest expenses totaled $23.6 billion, up 4% year-over-year. The increase was driven by higher compensation—particularly in front office and technology roles—as well as elevated marketing and brokerage costs. Notably, an FDIC special assessment accrual release of $323 million partially offset the overall rise.
Loan Growth and Deposit Trends
Average loans rose 2% year-over-year and were flat sequentially, while deposits increased 2% YoY and 1% QoQ. These trends suggest stable credit demand and consumer health, with no broad-based signs of stress despite headlines about rising default risks in the sector.
Consumer & Community Banking (CCB): Credit Resilience Holds
The CCB unit posted net income of $4.4 billion, down 8%, on $18.3 billion in revenue (+4% YoY). Credit card and auto lending revenue rose 12% to $6.9 billion, driven by higher card balances and lease income. Home lending revenue increased 2% to $1.2 billion. However, higher marketing and tech investments pushed noninterest expenses up 6%.
Credit costs in CCB came in at $2.6 billion, with $2.2 billion in charge-offs and a $475 million reserve build, mostly in card services due to seasoning of recent vintages. Still, the charge-offs remain manageable and are well within historical norms.
Corporate & Investment Bank (CIB): A Trading Bright Spot
The CIB segment reported net income of $6.9 billion on revenue of $19.7 billion, up 12% YoY. Investment banking fees rose 12% to $2.2 billion, led by debt underwriting and advisory strength, even as equity issuance lagged. Markets revenue rose 21% to $9.7 billion, with equities trading up 48%—a standout driven by derivative activity amid heightened volatility. FICC revenue came in at $5.8 billion, slightly below estimates, but still up 8%.
Provision for credit losses in CIB was $705 million, driven by reserve builds for specific exposures and shifts in the macro outlook. Expenses jumped 13% to $9.8 billion, mainly due to higher compensation and legal costs.
Reaffirms Full Year Outlook
JPMorgan reaffirmed its full-year 2025 guidance despite a challenging economic backdrop, projecting net interest income of approximately $94.5 billion (or $90 billion excluding Markets), adjusted expenses of around $95 billion, and a net charge-off rate of roughly 3.6% in its Card Services segment. The reaffirmation signals confidence in the bank’s ability to navigate ongoing macro volatility and tariff-related headwinds while maintaining financial discipline.
Bottom Line: No Cracks in the Armor
Despite geopolitical and tariff-related storm clouds, JPMorgan's Q1 showed no cracks in its credit quality or earnings power. Reserve builds were preemptive rather than reactive, and key segments—particularly equities trading and card lending—remain robust. Dimon’s caution is notable, but the fundamentals suggest the bank is not just prepared for turbulence—it’s positioned to weather it profitably. Investors appear to agree, with shares bouncing higher post-earnings. The bank may not be bulletproof, but this fortress still looks highly defensible.
Senior Analyst and trader with 20+ years experience with in-depth market coverage, economic trends, industry research, stock analysis, and investment ideas.
Latest Articles
Stay ahead of the market.
Get curated U.S. market news, insights and key dates delivered to your inbox.
AInvest
PRO
AInvest
PRO
Comments
No comments yet