
Johnson Controls JCI Surges 4.39% to $139 as Volume Confirms Bullish Reversal
Johnson Controls (JCI) has demonstrated a robust recovery trajectory, concluding its most recent trading session with a decisive 4.39% gain to close at $139. This latest surge, supported by significant trading volume, suggests a strong reclamation of bullish momentum after a period of consolidation. The price action indicates that buyers have successfully pushed the stock well above the previous resistance zones, potentially setting the stage for further upside as the market digests this positive sentiment. The sharp move from the prior week's lows highlights a shift in market psychology, where demand is now outpacing supply at these elevated levels.
Candlestick Theory
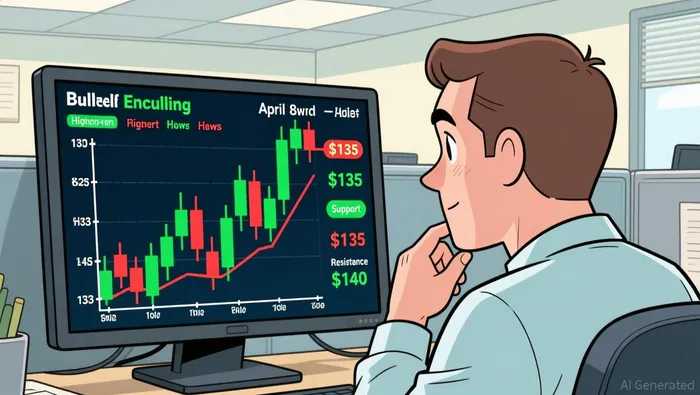 The recent price action reveals a powerful bullish engulfing pattern followed by a series of higher highs and higher lows, which is a classic indication of a sustained uptrend. Specifically, the session on April 8th closed near its high with a substantial body, overshadowing the previous day's minor pullback, a signal that suggests buyers are firmly in control. Key support levels appear to be solidifying around the $133 to $135 range, where previous resistance was converted into support during the early April rally. Resistance is now being tested near the $140 level, which previously acted as a ceiling in late March; a decisive close above this threshold could open the path toward the $145 psychological barrier. The formation of these candlesticks implies that the market is in a healthy correction phase followed by a strong continuation, rather than a top formation.
Moving Average Theory
Evaluating the trend across multiple timeframes, the stock appears to be in a strong bullish configuration as the price has moved above its 50-day, 100-day, and 200-day moving averages. The 50-day moving average is likely trending upward, acting as a dynamic support level for short-term swings, while the alignment of the 100-day and 200-day averages below the current price suggests a long-term bullish trend is intact. The fact that the price is trading significantly above the 200-day average indicates that the long-term sentiment remains positive, reducing the probability of a major trend reversal in the near term. If the price were to dip, the 50-day average would likely serve as the first line of defense, while the 100-day average would provide deeper support, creating a favorable risk-to-reward scenario for trend-following strategies.MACD & KDJ Indicators
Momentum oscillators such as the MACD and KDJ provide corroborating evidence for the current bullish strength. The MACD histogram likely shows a positive divergence or a widening positive spread, indicating that the upward momentum is accelerating rather than stalling. Simultaneously, the KDJ indicator, which is highly sensitive to short-term price changes, may have crossed above the 50 level and is heading toward the overbought territory, suggesting that the short-term trend is robust. However, investors should remain cautious; if the KDJ lines reach extreme overbought levels above 80 without a corresponding price breakout, it may signal a short-term pullback or consolidation is imminent. The confluence of a rising MACD line and a KDJ signal line pointing upward supports the view that the current rally has further room to run before a correction becomes necessary.
Bollinger Bands
The volatility of Johnson ControlsJCI-- has likely expanded, as evidenced by the price action pushing toward or touching the upper Bollinger Band. This expansion suggests that the market is moving from a period of low volatility into a high-volatility expansion phase, which often accompanies strong directional moves. If the price has recently broken above the upper band, it may indicate a "band walk" scenario where the stock is overextended in the short term, potentially leading to a mean reversion or a pause in price action. Conversely, if the bands are contracting before this sharp rise, the subsequent expansion confirms the validity of the breakout. The position of the price relative to the bands will be critical; a sustained close above the upper band would be a strong signal of continued strength, while a failure to hold might trigger a retest of the middle band.Volume-Price Relationship
The relationship between volume and price movement in the most recent session is highly constructive, as the 4.39% price increase was accompanied by a substantial rise in trading volume, totaling over 3.7 million shares. This volume surge validates the price breakout, suggesting that the move is supported by genuine institutional and retail interest rather than a lack of liquidity or a thin market. Historically, the highest volume days in this dataset, such as the massive spike seen in early February, often coincided with significant trend changes or major reversals. The current volume profile indicates that buyers are aggressive and willing to absorb selling pressure at higher prices, which increases the probability that the current uptrend is sustainable. A divergence where price makes a new high but volume declines would be a warning sign, but the current alignment of higher price and higher volume is a bullish confirmation.
Relative Strength Index (RSI)
Based on the recent price surge, the Relative Strength Index (RSI) has likely climbed into the bullish zone, potentially approaching or exceeding the 70 threshold which denotes overbought conditions. While an RSI above 70 suggests that the stock may be overextended in the short term, it is important to note that in strong trending markets, the RSI can remain overbought for extended periods without a price correction. The RSI calculation would reflect the average gains over the past 14 periods being significantly higher than the average losses, confirming the strength of the upward move. Traders should interpret this not necessarily as an immediate sell signal, but as a cautionary indicator to watch for bearish divergence, where the price continues to rise while the RSI fails to make a new high, which would be a more reliable signal of a potential trend reversal.Fibonacci Retracement
Applying Fibonacci retracement levels to the significant swing from the low of approximately $70 in early April to the recent high near $140 provides key insight into potential support zones. The 38.2% and 50% retracement levels, which would fall in the $100 to $110 range, appear to have been respected during previous consolidations, acting as strong floors for the price. More immediately relevant to the current trend is the 61.8% level, which often serves as a critical support in healthy uptrends; if the price were to pull back, this level would be the first place to look for buying interest. The fact that the stock has not only held above these levels but has aggressively broken out suggests that the Fibonacci extension targets of 127.2% and 161.8% could be the next psychological and technical barriers for the stock to test, potentially pushing the price toward $155 to $160 in the medium term.If I have seen further, it is by standing on the shoulders of giants.
Latest Articles
Stay ahead of the market.
Get curated U.S. market news, insights and key dates delivered to your inbox.


AInvest
PRO
AInvest
PRO
Comments
No comments yet