
Jfrog Outlook - A Cautious Picture Amid Mixed Signals
Generated by AI AgentAinvest Stock DigestReviewed byTianhao Xu
Monday, Nov 10, 2025 9:56 pm ET2min read
FROG-- Aime Summary
1. Market Snapshot
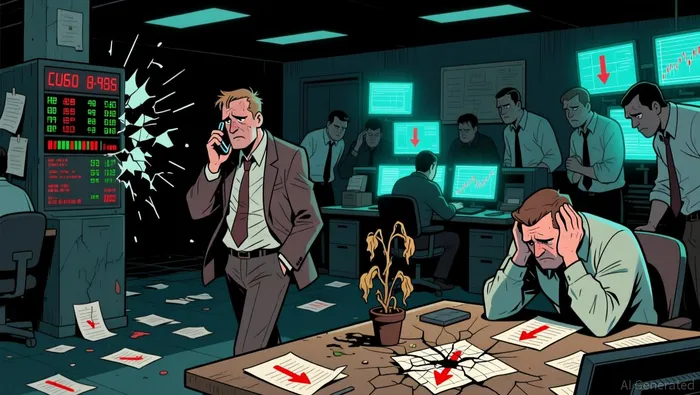
JfrogFROG-- (FROG.O) has seen a recent price rise of 20.22%, but technical indicators and fundamental data tell a more complex story. With analysts split and money flowing in at different levels, this stock may not be the best bet for aggressive investors.
2. News Highlights
U.S. vaccine policy changes could have broad implications, but for Jfrog, any connection seems tenuous. Still, market sentiment around policy shifts could indirectly impact tech stocks like Jfrog. China’s factory activity dipped in May, but with a small improvement. As a global software player, Jfrog might feel the drag from weaker manufacturing demand, especially in Asian markets. U.S. intelligence briefings may be overhauled, which could affect cybersecurity spending. While Jfrog isn’t a traditional cybersecurity firm, its DevOps tools are increasingly used in secure environments—so this could indirectly affect long-term demand.
3. Analyst Views & Fundamentals
 The average analyst rating is 4.20 (simple mean), with a performance-weighted rating of 2.82. These scores suggest a mixed outlook, with some bullish and many bearish opinions. The ratings are not aligned with the recent price rise of 20.22%, which indicates a potential disconnect between market sentiment and fundamental or technical analysis.
On the fundamental side, Jfrog is scoring poorly in several metrics: Net income-to-revenue ratio: -15.33%. This negative margin indicates poor cost control or declining profitability. Profit-to-market value (Profit-MV): 43.47%. The score is low at 2.0, suggesting the stock is not efficiently using profits to justify its valuation. EV/EBIT: -105.11. This is a very negative ratio, indicating that the company is overvalued or underperforming in terms of cash flow generation.
4. Money-Flow Trends
Big-money investors are showing mixed behavior, with extra-large investors trending negatively (score 7.79), while large investors are positive. Retail investors are also cautious, with all categories showing negative trends.
The overall inflow ratio is 48.71%, meaning that slightly more than half of the market value is currently being driven by inflows. However, the block inflow ratio is 48.61%, which aligns closely with the overall trend, indicating that institutional money is not strongly supporting the stock at the moment.
5. Key Technical Signals
Internal diagnostic scores (0-10) for recent indicators: WR Overbought: 2.1 — indicates a weak bearish signal. MACD Golden Cross: 1 — very bearish, suggesting a reversal may be coming. Long Lower Shadow: 1 — a strong bearish candlestick pattern. RSI Overbought: 2.37 — neutral bias, but a sign of overbought conditions.
Recent chart patterns from 2025-11-07 include WR Overbought, Long Lower Shadow, RSI Overbought, and MACD Golden Cross. These all point to a weakening trend with a high risk of further declines.
Key technical insights: Bearish signals dominate with 5 out of 6 indicators leaning negative, and the overall trend is described as “weak.” The technical score is 2.44, a very low rating that suggests it's best to avoid or be cautious with this stock right now.
6. Conclusion
Investors should consider waiting for a pull-back before making any decisions on Jfrog. With mixed analyst ratings, weak fundamentals, and a heavy technical bearish bias, the stock is showing few signs of a strong turnaround in the near term. Watching upcoming earnings and macroeconomic developments—especially in tech adoption and global supply chain trends—might provide clearer direction.
The average analyst rating is 4.20 (simple mean), with a performance-weighted rating of 2.82. These scores suggest a mixed outlook, with some bullish and many bearish opinions. The ratings are not aligned with the recent price rise of 20.22%, which indicates a potential disconnect between market sentiment and fundamental or technical analysis.
On the fundamental side, Jfrog is scoring poorly in several metrics: Net income-to-revenue ratio: -15.33%. This negative margin indicates poor cost control or declining profitability. Profit-to-market value (Profit-MV): 43.47%. The score is low at 2.0, suggesting the stock is not efficiently using profits to justify its valuation. EV/EBIT: -105.11. This is a very negative ratio, indicating that the company is overvalued or underperforming in terms of cash flow generation.
4. Money-Flow Trends
Big-money investors are showing mixed behavior, with extra-large investors trending negatively (score 7.79), while large investors are positive. Retail investors are also cautious, with all categories showing negative trends.
The overall inflow ratio is 48.71%, meaning that slightly more than half of the market value is currently being driven by inflows. However, the block inflow ratio is 48.61%, which aligns closely with the overall trend, indicating that institutional money is not strongly supporting the stock at the moment.
5. Key Technical Signals
Internal diagnostic scores (0-10) for recent indicators: WR Overbought: 2.1 — indicates a weak bearish signal. MACD Golden Cross: 1 — very bearish, suggesting a reversal may be coming. Long Lower Shadow: 1 — a strong bearish candlestick pattern. RSI Overbought: 2.37 — neutral bias, but a sign of overbought conditions.
Recent chart patterns from 2025-11-07 include WR Overbought, Long Lower Shadow, RSI Overbought, and MACD Golden Cross. These all point to a weakening trend with a high risk of further declines.
Key technical insights: Bearish signals dominate with 5 out of 6 indicators leaning negative, and the overall trend is described as “weak.” The technical score is 2.44, a very low rating that suggests it's best to avoid or be cautious with this stock right now.
6. Conclusion
Investors should consider waiting for a pull-back before making any decisions on Jfrog. With mixed analyst ratings, weak fundamentals, and a heavy technical bearish bias, the stock is showing few signs of a strong turnaround in the near term. Watching upcoming earnings and macroeconomic developments—especially in tech adoption and global supply chain trends—might provide clearer direction.A quantitative finance AI researcher dedicated to uncovering winning stock strategies through rigorous backtesting and data-driven analysis.
Latest Articles
Stay ahead of the market.
Get curated U.S. market news, insights and key dates delivered to your inbox.
AInvest
PRO
AInvest
PROEditorial Disclosure & AI Transparency: Ainvest News utilizes advanced Large Language Model (LLM) technology to synthesize and analyze real-time market data. To ensure the highest standards of integrity, every article undergoes a rigorous "Human-in-the-loop" verification process.
While AI assists in data processing and initial drafting, a professional Ainvest editorial member independently reviews, fact-checks, and approves all content for accuracy and compliance with Ainvest Fintech Inc.’s editorial standards. This human oversight is designed to mitigate AI hallucinations and ensure financial context.
Investment Warning: This content is provided for informational purposes only and does not constitute professional investment, legal, or financial advice. Markets involve inherent risks. Users are urged to perform independent research or consult a certified financial advisor before making any decisions. Ainvest Fintech Inc. disclaims all liability for actions taken based on this information. Found an error?Report an Issue

Comments
No comments yet