
IWM Whale Watch: $285 Puts Dominate as 2.39 Put/Call Ratio Signals Deep Caution
- Heavy put accumulation at $285 and $280 creates a formidable support floor for near-term downside.
- A stark 2.39 Put/Call Open Interest ratio reveals institutional hedging or bearish positioning over bullish speculation.
- Technicals show IWMIWM-- trading below key moving averages, with RSI nearing oversold territory at 33.2.
- Block trades in long-dated calls suggest some smart money is positioning for a longer-term rebound, despite current noise.
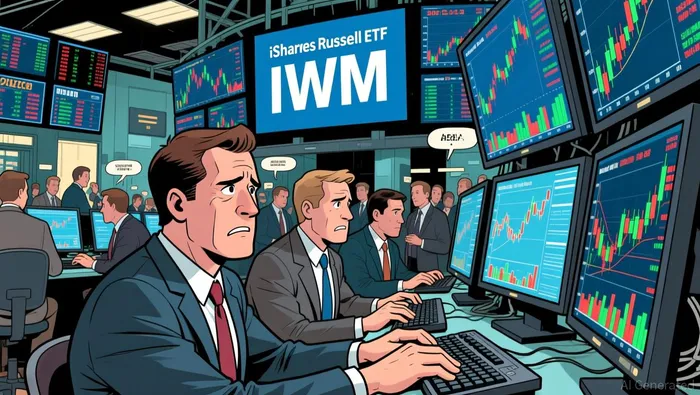
If you’re watching the Russell 2000 ETF (IWM) today, the mood is decidedly cautious. The market isn’t just whispering about risk; it’s shouting it through the options chain. With the ETF trading around $289.28, slightly up from yesterday’s close but well below its 30-day moving average, the tension is palpable. The dominant narrative here isn’t about an imminent rocket ship to the moon. It’s about protection. The options data screams that big players are buying insurance against a drop, specifically targeting the $285 level. While the technicals are mixed, the sheer volume of puts suggests that downside risk is the primary concern for institutional traders right now.
The Weight of Puts vs. The Hope of CallsLet’s look at the numbers, because they tell a story that charts alone can’t always capture. The Put/Call Open Interest ratio stands at a hefty 2.39. For context, a ratio above 1.0 generally indicates that more contracts are being written for puts than calls. This isn’t a slight imbalance; it’s a landslide. It means for every dollar of bullish call exposure, there’s nearly $2.40 of bearish put exposure. This kind of skew usually signals that smart money is hedging portfolios or betting on a pullback.
Looking at the specific strikes, the concentration is telling. This Friday’s expiration sees massive open interest in the $285 and $280 puts, with 31,103 and 35,165 contracts respectively. These aren’t random numbers. They represent a wall of support that, if breached, could accelerate selling. On the flip side, the call side is thinner, with the highest OI at $291 and $295. This asymmetry suggests that while there is some hope for a bounce back to $291, the market’s energy is focused on what happens if it fails to hold.
The block trades add another layer of intrigue. We saw significant activity in IWM20261218C310IWM20261218C310--, a long-dated call option expiring in December 2026. Someone bought 10,000 contracts worth $3.81 million. This is a long-shot bet. While the short-term data is bearish, this whale is positioning for a recovery six months out. It’s a divergence worth noting. The market is scared today, but someone is planning for the future. Meanwhile, the sale of IWM20260918P290IWM20260918P290-- suggests some traders are willing to collect premium by selling puts at $290, betting that the price won’t crash below that level this week.
News Flow and Market SentimentInterestingly, there’s no major breaking company-specific news driving this move. The absence of headlines means this price action is likely driven by broader macroeconomic factors or sector rotation rather than a single event. In the absence of catalysts, technical levels and options positioning become the primary drivers. The heavy put buying suggests that investors are worried about broader small-cap earnings pressures or interest rate implications, even if they aren’t talking about it in the news. This silence amplifies the options signal. When there’s no noise, the data speaks louder.
Actionable Trading OpportunitiesSo, how do we trade this? We need to respect the bearish bias but acknowledge the potential for a short-term bounce given the oversold RSI.
- For the Stock: Consider looking for entry points near the lower Bollinger Band support at $288.01. If IWM holds this level and the $285 put wall holds, a mean-reversion trade toward the 30-day moving average at $297.72 could offer a solid risk-reward setup. However, if it breaks below $288, expect a test of $285.
- For Options Traders: The heavy put OI at IWM20260918P285IWM20260918P285-- makes it an interesting candidate for a protective put strategy if you hold the underlying stock. Alternatively, if you believe the $285 floor is real, selling the IWM20260918P285 put could generate premium, but be aware of the high open interest—it could become a magnet for price action. For those betting on a rebound, the long-dated IWM20261218C310 block trade suggests that $310 is a realistic target in the medium term, though patience is required.
The setup for IWM is a tale of two timeframes. The short term is dominated by fear, evidenced by the overwhelming put volume and the breach of key moving averages. The long term, however, shows glimmers of confidence through those whale-sized call purchases. As we move through the week, watch the $285 level closely. It’s the battleground. If it holds, the market may stabilize. If it falls, the path of least resistance is down. For now, the prudent move is to hedge, not to heroically buy the dip.

Unlock Market-Moving Insights.
Subscribe to PRO Articles.
Already have an account? Sign in
Stay ahead of the market.
Get curated U.S. market news, insights and key dates delivered to your inbox.


AInvest
PRO
AInvest
PRO



