
IWM: Heavy Put Walls at 285 Signal Risk, But Short Squeeze Potential Points to 305 Breakout
- Price Action: IWMIWM-- dipped slightly to 300.765, holding above key short-term support despite a 0.31% daily decline.
- Options Sentiment: An extreme Put/Call Open Interest ratio of 2.65 suggests overwhelming bearish hedging, yet heavy put OI at 285 creates a potential floor.
- Technical View: MACD and RSI indicate a short-term bullish trend, with price trading well above the 30-day moving average of 295.49.
- Key Catalyst: High short interest (28.87% of float) combined with recent institutional preference for IWM liquidity sets the stage for a potential volatility spike.
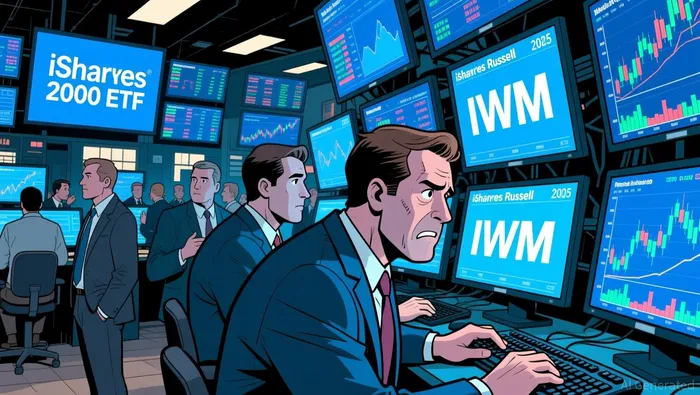
It’s easy to get distracted by the red numbers on your screen, isn't it? IWM is down just over 0.3% today, hovering around 300.765. But if you look closer, the story isn't about a minor dip. It’s about a market holding its breath. The options chain is screaming a specific narrative: traders are heavily hedging against a crash, but the structural setup might actually fuel a rally. Let’s break down what’s really happening beneath the surface.
The Weight of the Puts and the Block Trade CluesWhen you look at the options activity, the disparity is stark. The Put/Call Open Interest ratio sits at a massive 2.65. That’s not just bearish; that’s defensive. Traders are buying protection in droves. Specifically, look at the Open Interest for puts expiring this Friday (2026-08-07). The $285 strike has a staggering 92,629 contracts open, followed by $275 with 77,824. This isn’t random noise. These are the walls. Market makers and large institutions are positioning for a drop to these levels, which ironically creates a strong support zone. If price approaches $285, those put writers may be forced to buy shares to hedge, creating a bounce.
On the flip side, the call side is thin. The highest call OI this Friday is at $305 with just 5,896 contracts. This lack of resistance on the upside is interesting. It suggests that if the stock can break above the current intraday high of 303.06, there isn’t a massive wall of call sellers waiting to cap the move.
Then there are the block trades. We saw significant activity in IWM20260828P295IWM20260828P295-- with a volume of 21,161 contracts and nearly $6.75 million in turnover. We also saw IWM20260821P286IWM20260821P286-- with a similar volume of 21,161 contracts, specifically noted as a "sell put" direction. Selling puts at $286 is a bullish signal in disguise. It means smart money is willing to buy the dip at $286, confident that IWM won’t stay there. They are collecting premium, betting on stability or a rise. This contradicts the heavy put buying at 285, creating a complex battle zone between hedgers and opportunistic buyers.
News Flow: The Short Squeeze NarrativeThe fundamental backdrop adds fuel to this fire. Recent data reveals that short interest in IWM stands at nearly 29% of the public float. That is enormous. While the short interest decreased slightly by 0.39% recently, the absolute level remains a ticking time bomb for bears. The "days to cover" is 4.2, which is manageable but high enough to cause pain if buying pressure accelerates.
Why does this matter? Because institutional investors are increasingly favoring IWM over peers like IJR or VB due to its superior liquidity. When institutions pile into a heavily shorted asset, you get a squeeze. The news highlights that IWM is a primary vehicle for macro hedging, but the recent price appreciation despite high short interest suggests that the bears are losing ground. The market is pricing in a scenario where the heavy hedging (puts) meets the short covering (buybacks), creating a perfect storm for upside volatility.
Trading Opportunities: Where to Place Your BetsSo, how do we trade this? The technicals support a bullish bias. The MACD is positive (0.57), and the RSI is at 58, leaving plenty of room for growth before overbought conditions. The price is comfortably above the 30-day MA of 295.49 and the 100-day MA of 279.52.
For the stock traders:
- Entry: Consider entering near $300.10 (the intraday low) if it holds, or on a breakout above $303.06 (the intraday high).
- Target: The first target is $305, where call OI is lowest, suggesting a clear path. A secondary target is $315 for next week’s expiration.
- Stop Loss: A close below $299.69 (the lower Bollinger Band) would invalidate the short-term bullish momentum.
For the options traders:
- Bullish Play: Buy IWM20260814C305IWM20260814C305--. This is next Friday’s expiration. The OI is only 8,753, meaning low resistance. If IWM breaks 303, this contract has high gamma potential. It’s cheaper than the weekly and gives you more time for the thesis to play out.
- Conservative Play: Sell IWM20260821P286. As seen in the block trades, this is a popular strike. Selling this put allows you to collect premium while defining your risk at $286. If IWM stays above 286, you keep the full credit.
- Speculative Hedge: If you fear a drop, avoid buying the cheap $285 puts. They are too crowded. Instead, look at IWM20260807P290IWM20260807P290-- if you want a tighter hedge, but be aware that the heavy OI at 285 makes it a likely support bounce zone.
The data paints a picture of a market that is oversold in sentiment but technically strong. The heavy put walls at 285 and 275 are not just barriers; they are potential launchpads. The high short interest combined with institutional preference for IWM’s liquidity creates a unique environment where a small surge in buying could trigger a disproportionate move upward.
Don’t let the minor red day fool you. The options market is pricing in fear, but the block trades and technicals are whispering about opportunity. Watch $303.06 closely. If it breaks, the path to $315 is clear. If it fails, the floor at $285 is solid. Either way, expect volatility. The squeeze is loading up, and the market is waiting for a spark.

Unlock Market-Moving Insights.
Subscribe to PRO Articles.
Already have an account? Sign in
Stay ahead of the market.
Get curated U.S. market news, insights and key dates delivered to your inbox.


AInvest
PRO
AInvest
PRO



