
ITGR Breaks To A New High On Buyout Talk: Momentum Versus Deal Uncertainty
 Aime Summary
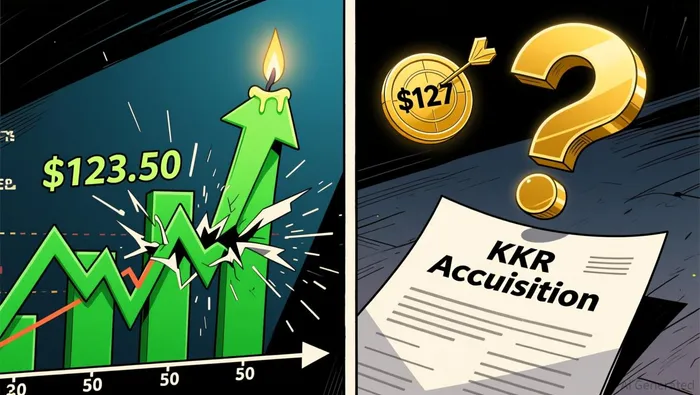
Integer Holdings (ITGR) surged 20.18% to close at $121.21 in the latest session, printing a new 52-week high after a Wall Street Journal report that KKRKKR-- is nearing a deal to take the medical-device outsourcing company private, according to Morningstar / Dow Jones. The technical conflict is sharp: a high-volume breakout into record territory against a deeply overbought reading, with the catalyst still unconfirmed as a definitive agreement.
Why This Setup Matters Now
ITGR entered the technical-analysis queue after appearing on the Yahoo Finance day gainers screen with a double-digit move of 20.18%, according to Yahoo Finance market movers. The trigger is a report, cited by Seeking Alpha, that KKR is close to an agreement to buy the company for about $127 a share, with talks still ongoing and no definitive agreement announced, per MarketScreener. Quote data below is from Yahoo Finance.
Table 1: Market Snapshot
| Metric | Value |
|---|---|
| Price | $121.21 |
| Change | +$20.35 (+20.18%) |
| Day range | $99.52 to $123.50 |
| 52-week range | $62.00 to $123.50 |
| Session volume | About 2.6M shares |
| Market cap | About $4.1B |
Quick Read
The main technical question is whether a single-session, event-driven spike can hold, and how much room remains toward the reported $127 deal price.
Table 2: Quick Read
| Question | Read |
|---|---|
| Breakout status | New 52-week high |
| Extension | 29% above 50-day average |
| Momentum | Overbought, RSI near 84 |
| Catalyst | Reported KKR buyout talk |
| Confirmation | No definitive agreement yet |
Technical Bias
Scorecard inputs use averages and RSI from Yahoo Finance and Investing.com.
Table 3: Technical Bias
| Factor | Reading | Lean |
|---|---|---|
| Trend | Above 50d and 200d averages | Bullish |
| Breakout | New 52-week high on volume | Bullish |
| Volume | About 4.9x the 3-month average | Bullish |
| Momentum | RSI near 84, extended | Cautious |
| Event risk | Deal not confirmed | Cautious |
Key Levels To Watch
Levels below the close are derived zones from the daily range and prior consolidation, not confirmed historical support. Chart range data is from Yahoo Finance.
Table 4: Key Levels
| Level | Zone | Type |
|---|---|---|
| $127 | Reported deal price | Watch area |
| $123.50 | Day and 52-week high | Watch area |
| $115 | Round-number zone | Derived support |
| $111 to $112 | Midpoint of day range | Derived support |
| $100 to $102 | Prior consolidation top | Not confirmed support |
Scenario Map
Table 5: Scenario Map
| Scenario | Trigger | Bias |
|---|---|---|
| Strong | Close above $123.50 | Bullish |
| Deal confirmed | News near $127 | Bullish |
| Base | Hold above $111 | Neutral to bullish |
| Weak | Break below $108 | Bearish |
Momentum And Volume Check
The session ran on about 2.6M shares against a 3-month average of roughly 531K, a near 5x volume multiple. RSI-14 computed from the daily chart sits near 84, and the trend strength reading from Investing.com is elevated. Chart data is from Yahoo Finance.
Table 6: Momentum Check
| Indicator | Reading |
|---|---|
| RSI-14 | Near 84, overbought |
| Volume vs 3m average | About 4.9x |
| Price vs 50d average | 29% above |
| Price vs 200d average | 43% above |
| Trend strength | Strong, high ADX |
What Would Change The View
Table 7: View Change Checklist
| Event | Effect |
|---|---|
| Definitive deal at or above $127 | Strongly bullish |
| Deal falls apart or terms cut | Bearish |
| Daily close below $111 | Trend weakens |
| Volume fades on pullback | Healthier consolidation |
| RSI cools below 70 | Reduces extension risk |
Bottom Line
Bottom line: ITGRITGR-- remains bullish as long as it holds above the $111 to $113 derived support zone. A move above $127 would strengthen the setup, while a break below $100 to $102 would weaken the chart.
Summary
- ITGR closed up 20.18% at $121.21 after a report that KKR is near a deal to buy the company for about $127 a share.
- The stock printed a new 52-week high at $123.50 on about 4.9x average volume.
- Price sits 29% above the 50-day average with RSI near 84, a clearly extended reading.
- The reported deal price of $127 sits above the close, but the transaction is not confirmed.
- A close below the $111 to $113 derived zone would start to weaken the breakout.
Disclaimer
This article is for informational purposes only and does not constitute financial advice. Technical indicators can help frame risk and momentum, but they do not guarantee future price movement.

Stay ahead of the market.
Get curated U.S. market news, insights and key dates delivered to your inbox.


AInvest
PRO
AInvest
PRO




Comments
No comments yet