
IRUSDT Volume Spikes Fail to Spark Breakout
 Aime Summary
Summary
- IRUSDT exhibits range-bound behavior with significant intraday volatility and volume spikes.
- Price remains near support levels, showing rejection at resistance with long upper shadows.
- Recent volume anomalies suggest weak follow-through, indicating potential consolidation or reversal.
- Market structure favors sideways movement with cautious upside potential if support holds.
- Key levels to monitor include immediate support at 0.0083 and resistance at 0.0090.
Range-Bound Volatility
Infrared/Tether (IRUSDT) traded within a narrow range, closing the latest 1H candle at 0.00892 with a high of 0.00895 and low of 0.00848. The 24-hour total volume was approximately 2.8 million USDT, reflecting moderate activity compared to recent averages.
1-Hour Support/Resistance and Candlestick Patterns
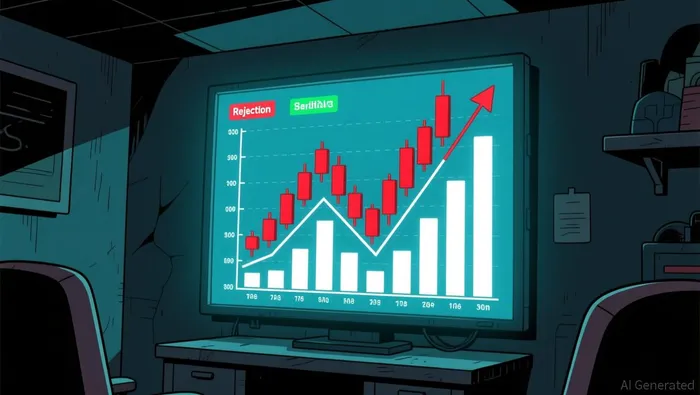
Price action indicates a range-bound market structure with clear rejection at resistance. The asset encountered significant selling pressure near 0.00975, where a long upper shadow formed, signaling strong resistance. Another rejection occurred around 0.00870, marked by multiple candles with long upper shadows, suggesting sellers are active at higher prices. On the downside, support appears to be forming near 0.00830, where price has found buying interest after dips. Candlestick patterns reveal indecision, with several doji candles and those with long upper shadows appearing frequently. These patterns suggest that buyers are unable to sustain upward momentum, and sellers are defending key resistance levels. The price is currently closer to the support level of 0.00830 than to the immediate resistance at 0.00900, indicating a potential bias towards consolidation or slight downward pressure if support fails.
Volume and Turnover vs. Historical Comparison
The 24-hour total volume of approximately 2.8 million USDT is below the 7-day average daily volume of 2.1 million USDT and the 15-day average of 1.7 million USDT, suggesting a decrease in overall trading activity. However, specific hours showed significant volume spikes. The hour ending at 01:00 on August 2nd recorded a volume of 373,980 USDT, which is more than double the average single-hour volume of 88,186 USDT. This spike coincided with a price drop, indicating selling pressure. Similarly, the hour ending at 02:00 had a volume of 380,621 USDT, also above the average, with further price decline. These high-volume periods did not result in sustained price movement in the direction of the spike, suggesting a lack of conviction or absorption by limit orders. The volume anomalies appear to have driven short-term price adjustments but did not lead to a clear breakout, indicating that the volume spikes may be due to liquidations or stop-losses rather than strong directional interest.
Look Back: Current Market Phase
Over the past 7-15 days, the market has exhibited a sideways phase. The price has oscillated within a range, with no clear trend of higher highs and higher lows or lower highs and lower lows. The 7-day price change is approximately 17.37%, which might suggest a mean reversion scenario if the prior move was sharp. However, the recent price action shows consolidation, with the price staying within a relatively narrow band. The market structure feature is identified as range bound, supporting the view that the asset is in a consolidation phase. This phase is characterized by periods of low volatility interspersed with short bursts of higher volatility, as seen in the volume spikes. The current phase suggests that the market is digesting previous moves and is likely to continue ranging until a significant catalyst or volume-driven breakout occurs.
The market is likely to remain range-bound in the next 24 hours, with price fluctuating between key support and resistance levels. An upside break above 0.00900 could signal renewed buying interest, while a downside break below 0.00830 may lead to further declines towards 0.00800.

Decoding market patterns and unlocking profitable trading strategies in the crypto space
Latest Articles
Stay ahead of the market.
Get curated U.S. market news, insights and key dates delivered to your inbox.


AInvest
PRO
AInvest
PRO




Comments
No comments yet