
IRUSDT Volume Spikes Fail to Fuel Rally, Sellers Retain Control
 Aime Summary
Summary
- IRUSDT trades in a tight consolidation range following a sharp intraday rejection.
- Volume spikes on August 2 failed to sustain upward momentum, indicating seller dominance.
- Price remains closer to immediate support levels, suggesting limited upside potential.
- Market structure appears range-bound with no clear trend direction established.
- Caution advised as price action suggests potential downside if support breaks.
Intraday Range Contraction
Infrared/Tether (IRUSDT) closed the 24-hour period with a 1H price of 0.00892, trading within a narrow band between 0.00818 and 0.00975. The 24-hour total volume reached approximately 2.5 million, slightly below the 7-day average of 2.1 million. Turnover reflects moderate liquidity with no significant breakout events.
1-Hour Support/Resistance and Candlestick Patterns
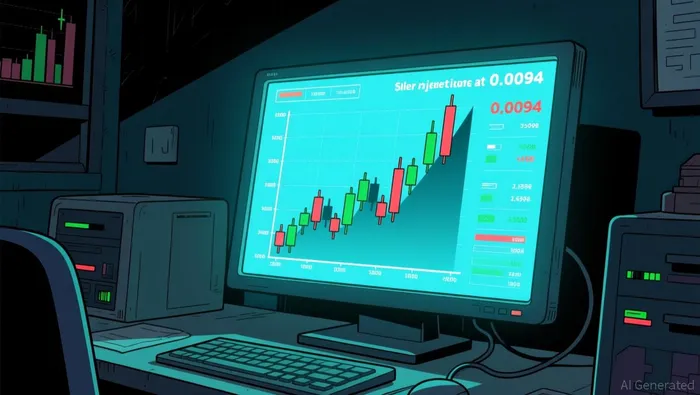
Price action in the latest session highlights 0.0088 and 0.0086 as immediate support zones, where multiple rejections occurred. The 0.0094 level acted as strong resistance, marked by a distinct long upper shadow rejection during the 01:00 hour candle. Another rejection occurred near 0.0092, confirming seller presence at higher levels. The candlestick patterns show a doji forming at 06:00, indicating indecision after the earlier drop. The price is currently closer to the 0.0088 support level than the 0.0094 resistance, suggesting a slight bearish bias in the short term.
Volume and Turnover vs. Historical Comparison
The 24-hour total volume of roughly 2.5 million is comparable to the 7-day average daily volume of 2.1 million, indicating standard trading activity. However, specific hourly spikes exceeded twice the 7-day average single-hour volume of 88,186. Notable spikes occurred at 14:00 on August 1 (436,599) and 15:00 on August 1 (996,422). Following the 15:00 spike, price initially rose but failed to hold gains, closing lower within the next few hours. This high volume with no follow-through suggests distribution rather than accumulation. The subsequent spike at 01:00 on August 2 (373,980) also resulted in a price decline, reinforcing that volume anomalies did not drive sustained upward movement.
Look Back: Current Market Phase
Analyzing the 7-15 day structure reveals a market phase characterized by a sideways or range-bound state. Although there was a recent 7-day price change of approximately 17.4%, the current price action shows lower highs and lower lows relative to the immediate peak, yet price remains within a defined channel. The 15-day daily price range of 0.01 confirms limited volatility expansion. The structure does not exhibit a clear uptrend with higher highs nor a sustained downtrend with lower lows consistently. Instead, price oscillates within a band, suggesting a consolidation phase following the earlier volatility. This indicates a mean reversion context where price seeks equilibrium within the established range.
Looking ahead, IRUSDT may continue to test support levels if selling pressure persists. A break below 0.0084 could trigger further downside risk, while a sustained move above 0.0092 would be required for any meaningful upside recovery.

Decoding market patterns and unlocking profitable trading strategies in the crypto space
Latest Articles
Stay ahead of the market.
Get curated U.S. market news, insights and key dates delivered to your inbox.


AInvest
PRO
AInvest
PRO




Comments
No comments yet