
IQ Plunges Despite 12M Volume Spike — Breakout Lurks
Generated by AI AgentAinvest Crypto Technical RadarReviewed byDavid Feng
Thursday, Apr 2, 2026 8:59 pm ET1min read
IQ-- Aime Summary
IQ/Tether (IQUSDT) opened at 0.001050 on 2026-04-01 12:00 ET and reached a high of 0.001066 before closing at 0.001022 by 2026-04-02 12:00 ET. The low for the day was 0.001010. Total volume traded was 84,803,443.0 with a notional turnover of 87,414.20.
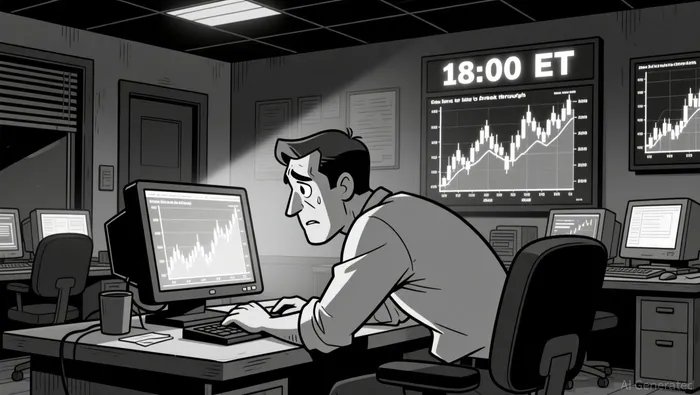
Price action during the session showed a bearish consolidation, with the 0.001052–0.001055 range acting as a key resistance cluster. A bearish engulfing candle formed at 18:00 ET, suggesting rejection at higher levels. A potential 61.8% Fibonacci retracement level at 0.001047 was tested twice but failed to hold.
The 5-minute MACD showed a bearish crossover during the 01:15–01:30 ET block, coinciding with high volume and a failed break. The RSI maxed out at 68, failing to enter overbought territory, indicating a lack of conviction in the bullish move. On the daily chart, the price remained below the 50-period and 200-period moving averages, pointing to bearish bias in longer-term trends.
Bollinger Bands experienced a clear contraction during the final six hours of the session, suggesting reduced volatility and potential for a breakout. Price hovered near the lower band for much of the day, reinforcing a bearish trend. The 20-period BB showed a tight squeeze as the close approached, indicating a possible reversal or continuation into the next session.
A sharp spike in volume occurred at 01:15 ET, with over 12 million contracts traded, but the price response was muted. This divergence raises questions about the strength of the bearish move. Turnover mirrored the volume surge, suggesting real liquidity shifts but not a decisive trend reversal. Volume generally declined after 04:00 ET, as the market settled into a consolidation phase.
A breakout above 0.001055 could retest the 0.001060–0.001066 range, but a failure to do so would likely send price testing 0.001040–0.001035 support. Traders should monitor the 50-period moving average on the daily chart as a critical level for the next 24 hours. As always, sudden market news or macro shifts could disrupt this pattern.
Summary
• Price consolidated between 0.001043 and 0.001055 during the session.
• A bearish engulfing pattern formed at the 18:00 ET high, suggesting short-term resistance.
• Volume surged past 12 million at 01:15 ET, but price failed to follow through.
• RSI hit overbought territory but failed to break 70, indicating stalled bullish momentum.
• Bollinger Bands tightened in the final 6 hours, signaling potential breakout risk.
24-Hour Price and Volume Summary
IQ/Tether (IQUSDT) opened at 0.001050 on 2026-04-01 12:00 ET and reached a high of 0.001066 before closing at 0.001022 by 2026-04-02 12:00 ET. The low for the day was 0.001010. Total volume traded was 84,803,443.0 with a notional turnover of 87,414.20.
Structure and Candlestick Patterns
Price action during the session showed a bearish consolidation, with the 0.001052–0.001055 range acting as a key resistance cluster. A bearish engulfing candle formed at 18:00 ET, suggesting rejection at higher levels. A potential 61.8% Fibonacci retracement level at 0.001047 was tested twice but failed to hold.
Trend and Momentum Signals
The 5-minute MACD showed a bearish crossover during the 01:15–01:30 ET block, coinciding with high volume and a failed break. The RSI maxed out at 68, failing to enter overbought territory, indicating a lack of conviction in the bullish move. On the daily chart, the price remained below the 50-period and 200-period moving averages, pointing to bearish bias in longer-term trends.
Volatility and Bollinger Bands
Bollinger Bands experienced a clear contraction during the final six hours of the session, suggesting reduced volatility and potential for a breakout. Price hovered near the lower band for much of the day, reinforcing a bearish trend. The 20-period BB showed a tight squeeze as the close approached, indicating a possible reversal or continuation into the next session.
Volume and Turnover Analysis
A sharp spike in volume occurred at 01:15 ET, with over 12 million contracts traded, but the price response was muted. This divergence raises questions about the strength of the bearish move. Turnover mirrored the volume surge, suggesting real liquidity shifts but not a decisive trend reversal. Volume generally declined after 04:00 ET, as the market settled into a consolidation phase.
Forward-Looking Observations
A breakout above 0.001055 could retest the 0.001060–0.001066 range, but a failure to do so would likely send price testing 0.001040–0.001035 support. Traders should monitor the 50-period moving average on the daily chart as a critical level for the next 24 hours. As always, sudden market news or macro shifts could disrupt this pattern.
Decoding market patterns and unlocking profitable trading strategies in the crypto space
Latest Articles
Stay ahead of the market.
Get curated U.S. market news, insights and key dates delivered to your inbox.


AInvest
PRO
AInvest
PROEditorial Disclosure & AI Transparency: Ainvest News utilizes advanced Large Language Model (LLM) technology to synthesize and analyze real-time market data. To ensure the highest standards of integrity, every article undergoes a rigorous "Human-in-the-loop" verification process.
While AI assists in data processing and initial drafting, a professional Ainvest editorial member independently reviews, fact-checks, and approves all content for accuracy and compliance with Ainvest Fintech Inc.’s editorial standards. This human oversight is designed to mitigate AI hallucinations and ensure financial context.
Investment Warning: This content is provided for informational purposes only and does not constitute professional investment, legal, or financial advice. Markets involve inherent risks. Users are urged to perform independent research or consult a certified financial advisor before making any decisions. Ainvest Fintech Inc. disclaims all liability for actions taken based on this information. Found an error?Report an Issue

ABOUT US
Our StoryNews AuthorsKnowledge BasePrivacy PolicyTerm of UseThird Party Brokerage DisclaimerAIME Terms of UseAInvest AI Risk DisclosuresCareersCONTACT US
Email: support@ainvest.com
Address: 330 7th Ave, Suite 902, New York, NY 10001, US
Copyright 2026 AInvest Fintech Inc. All rights reserved.
Comments
No comments yet