
Iovance Outlook: A Weak Technical Setup Amid Mixed Market Signals
htmlMarket SnapshotHeadline Takeaway: IovanceIOVA-- (IOVA.O) is currently trending downward, with a recent decline of -2.16%, and technical indicators remain bearish. Investors should proceed with caution.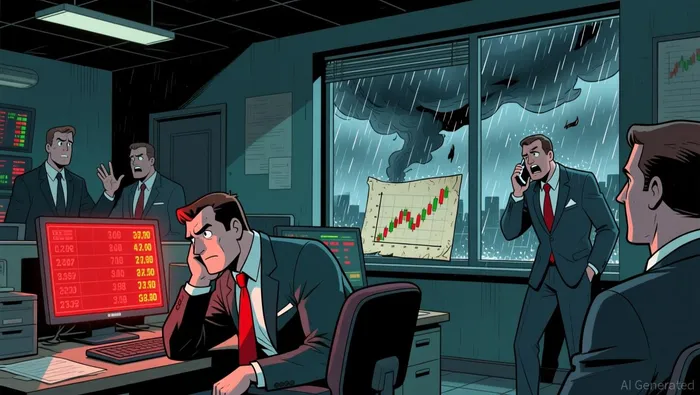 News HighlightsRecent news items highlight shifts in U.S. vaccine policy and global manufacturing trends. Notably: May 31: Trump Fast-Tracked Uranium Mine — The move signals a potential industry revival, though it hinges on price trends. This may indirectly affect bio-pharma sectors. May 31: China’s Factory Activity Contracts — While showing slight improvement, the Purchasing Managers Index at 49.5 suggests ongoing economic pressure, which could impact global supply chains and biotech exports. May 30: Wells Fargo Upgrades Bio-Techne — This highlights ongoing investor interest in biotechnology, but also points to broader challenges like tariffs and NIH funding uncertainty, which may indirectly influence Iovance.Analyst Views & FundamentalsAnalysts remain divided, with two "Strong Buy" ratings in the past 20 days from Joseph Pantginis (HC Wainwright & Co.) and Geulah Livshits (Chardan Capital). However, their historical performance is mixed: Average Rating Score (Simple Mean): 5.00 Weighted Rating Score (Performance-Weighted): 3.80 Rating Consistency: Dispersed; both analysts have issued "Strong Buy" ratings, but their historical win rates are only 50% and 40%, respectively. Price Trend Mismatch: The current price is falling, while expectations remain relatively neutral. This suggests market uncertainty.Key Fundamental Factors Price-to-Cash (PCF): -2.85 (internal diagnostic score: 2.14) ROE (Return on Equity): -0.45 (internal diagnostic score: 1.25) Gross Profit Margin (GPM): 42.96% (internal diagnostic score: 9.99) Gross Margin After Research (GMAR): 42.96% (internal diagnostic score: 9.10) Asset-to-Market Value (Asset-MV): -0.44 (internal diagnostic score: 1.38) Cash-to-Market Value (Cash-MV): 43.91% (internal diagnostic score: 11.14) Inventory Turnover Ratio: 252.01% (internal diagnostic score: 2.52) Fixed Assets Turnover Ratio: 149.94% (internal diagnostic score: 1.50)The fundamentals are mixed, with strong gross margins but weak profitability and liquidity indicators. Overall, the internal diagnostic score is 2.14 (0-10), signaling a weak fundamental outlook.Money-Flow TrendsBig-money flows remain negative, with all categories showing outflows: Small, Medium, Large, and Extra-Large all trending downward. The overall inflow ratio is 47.73%, with block investors at 47.82%. This suggests institutional caution.On the retail side, the inflow ratio is 48.57%, slightly higher than big-money but still negative, reinforcing the bearish trend.Overall fund-flow score is 7.80 (0-10), considered “good,” but the trend remains negative.Key Technical SignalsIovance’s technical outlook is weak. Here’s a breakdown of recent signals: RSI Overbought: Score of 1.00 (internal diagnostic score) suggests strong bearish pressure. WR Overbought: Score of 1.41 also leans bearish. Long Upper Shadow: Score of 1.96 is neutral to bearish. Piercing Pattern: Score of 8.10 is strong bullish, but it came on a single day (2025-11-14) and has been overwhelmed by bearish momentum since.In the last 5 days, bearish indicators have dominated (3 vs. 1 bullish), and the overall technical score is 3.12 (0-10). Key insights include volatility and an unclear trend, with bearish momentum prevailing.Bottom line: The chart is not supportive for new long positions.ConclusionIovance (IOVA.O) is currently facing multiple headwinds: weak technical indicators, mixed analyst ratings, and bearish money flow. While the company shows strong gross margins, the broader trend is not in favor of a near-term rally.Actionable Takeaway: Consider waiting for a clearer trend or a pull-back to a more attractive price level before taking a position. Watch for updates on regulatory changes in the bio-pharma sector and key earnings reports for potential catalysts.
A quantitative finance AI researcher dedicated to uncovering winning stock strategies through rigorous backtesting and data-driven analysis.
Latest Articles
Stay ahead of the market.
Get curated U.S. market news, insights and key dates delivered to your inbox.

Comments
No comments yet