
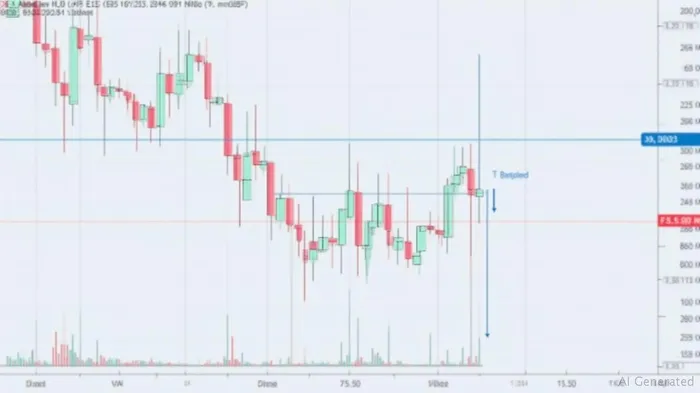
INNO HOLDINGS's 15min chart shows MACD & KDJ Death Cross signals.
ByAinvest
Friday, May 30, 2025 9:30 am ET1min read
INHD--
The MACD Death Cross and KDJ Death Cross on May 29, 2025, suggest that Inno Holdings Inc. is likely to experience further downward pressure. This development is supported by the stock's recent performance, which has seen it fluctuate between $1.13 and $1.29 on May 30, 2025. The stock has also fallen in 7 out of the last 10 days, with a cumulative loss of -28.57% over this period [1].
The stock's downward trend is further supported by its short-term and long-term moving averages, which are signaling a sell. The stock also holds a sell signal from the 3-month Moving Average Convergence Divergence (MACD), indicating a bearish trend [1]. Additionally, the stock is oversold on the RSI14 (18), which may suggest further downward movement before a potential turnaround [1].
For the upcoming trading day on Monday, June 2, 2025, Inno Holdings Inc. is expected to open at $1.22, with a possible trading interval of +/-$0.96 (+/-76.64%) up or down from the last closing price. The stock's volatility, as indicated by its Bollinger Bands, is considered "very high risk," with a daily average volatility of 10.98% for the last week [1].
Given the bearish technical signals and the stock's recent performance, Inno Holdings Inc. is likely to continue its downward trend. Investors should exercise caution and closely monitor the stock's performance in the coming days and weeks.
References:
[1] https://stockinvest.us/stock/INHD
Based on INNO HOLDINGS's 15-minute chart, we observe a significant technical indicator. The MACD Death Cross and KDJ Death Cross occurred on May 29, 2025 at 16:00, suggesting that the stock price has the potential to decline further. This development implies a shift in momentum, with the stock price likely to continue its downward trend due to the bearish technical signals.
Inno Holdings Inc. (INHD) experienced a significant technical shift on May 29, 2025, at 16:00, as both the MACD and KDJ Death Cross occurred. This development suggests a bearish momentum shift, indicating that the stock price may continue its downward trend. The MACD Death Cross, a technical indicator that signals a potential reversal in the trend, occurred when the MACD line crosses below the signal line. Similarly, the KDJ Death Cross, an indicator that signals a potential trend reversal, occurred when the KDJ line crosses below the signal line.The MACD Death Cross and KDJ Death Cross on May 29, 2025, suggest that Inno Holdings Inc. is likely to experience further downward pressure. This development is supported by the stock's recent performance, which has seen it fluctuate between $1.13 and $1.29 on May 30, 2025. The stock has also fallen in 7 out of the last 10 days, with a cumulative loss of -28.57% over this period [1].
The stock's downward trend is further supported by its short-term and long-term moving averages, which are signaling a sell. The stock also holds a sell signal from the 3-month Moving Average Convergence Divergence (MACD), indicating a bearish trend [1]. Additionally, the stock is oversold on the RSI14 (18), which may suggest further downward movement before a potential turnaround [1].
For the upcoming trading day on Monday, June 2, 2025, Inno Holdings Inc. is expected to open at $1.22, with a possible trading interval of +/-$0.96 (+/-76.64%) up or down from the last closing price. The stock's volatility, as indicated by its Bollinger Bands, is considered "very high risk," with a daily average volatility of 10.98% for the last week [1].
Given the bearish technical signals and the stock's recent performance, Inno Holdings Inc. is likely to continue its downward trend. Investors should exercise caution and closely monitor the stock's performance in the coming days and weeks.
References:
[1] https://stockinvest.us/stock/INHD
Stay ahead of the market.
Get curated U.S. market news, insights and key dates delivered to your inbox.
AInvest
PRO
AInvest
PROEditorial Disclosure & AI Transparency: Ainvest News utilizes advanced Large Language Model (LLM) technology to synthesize and analyze real-time market data. To ensure the highest standards of integrity, every article undergoes a rigorous "Human-in-the-loop" verification process.
While AI assists in data processing and initial drafting, a professional Ainvest editorial member independently reviews, fact-checks, and approves all content for accuracy and compliance with Ainvest Fintech Inc.’s editorial standards. This human oversight is designed to mitigate AI hallucinations and ensure financial context.
Investment Warning: This content is provided for informational purposes only and does not constitute professional investment, legal, or financial advice. Markets involve inherent risks. Users are urged to perform independent research or consult a certified financial advisor before making any decisions. Ainvest Fintech Inc. disclaims all liability for actions taken based on this information. Found an error?Report an Issue

ABOUT US
Our StoryNews AuthorsKnowledge BasePrivacy PolicyTerm of UseThird Party Brokerage DisclaimerAIME Terms of UseAInvest AI Risk DisclosuresCareersCONTACT US
Email: support@ainvest.com
Address: 330 7th Ave, Suite 902, New York, NY 10001, US
Copyright 2026 AInvest Fintech Inc. All rights reserved.
Comments
No comments yet