
Inlif Ignites: 167% Intraday Surge Defies Sector Gravity in a Volatile Trading Session
 Aime Summary
Summary
• InlifINLF-- (INLF) erupts with a massive 167.45% intraday gain, closing near $8.505 after a volatile session.

• Turnover rate explodes to nearly 4,000%, signaling extreme speculative interest and liquidity churn.
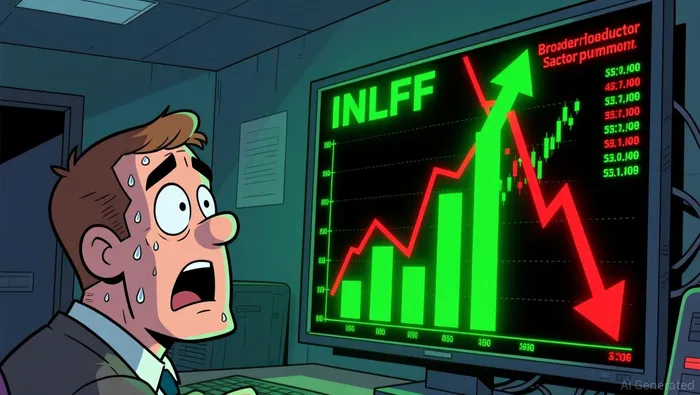
• The stock traded between a low of $5.40 and a high of $9.48, showcasing wild intraday volatility.
Despite a semiconductor sector weighed down by recent monthly corrections, INLFINLF-- decoupled from broader trends, executing a parabolic move that defies traditional valuation metrics and sector headwinds.
Speculative Frenzy Drives Inlif’s Parabolic Breakout
The catalyst for INLF’s explosive 167.45% surge is not found in fundamental corporate news, as no specific company announcements were reported. Instead, the move is driven by pure speculative momentum and extreme capital rotation. With a turnover rate of 3,983.76%, the stock experienced a massive reshuffling of ownership, suggesting that short-term traders and momentum funds are aggressively betting on a short squeeze or a breakout from its previous consolidation phase. The price action, which swung from a low of $5.40 to a high of $9.48 before settling at $8.505, indicates a battle between profit-taking and aggressive buying pressure that ultimately favored the bulls, pushing the stock far above its previous close of $3.18.
Semiconductor Sector: Contrarian Buying Amid Selloff
While INLF surged on speculative energy, the broader semiconductor sector told a different story of contrarian accumulation. The iShares Semiconductor ETF (NASDAQ:SOXX) suffered its worst monthly performance since December 2002, plunging 22.1% in July. However, this price weakness masked strong institutional conviction, with SOXX attracting a record $6.92 billion in net inflows during the month alone. This divergence highlights a market where large-cap leaders are being bought as a value play, while small-cap names like INLF are being traded on pure momentum and volatility, completely decoupling from the fundamental sector narrative.
Technical Breakout Analysis and Volatility Play
The technical landscape for INLF reveals a stock in a short-term bearish trend but exhibiting strong long-term bullish potential, as evidenced by its position relative to key moving averages. Below is the current technical snapshot:
• 200-Day Moving Average: 1.6999 (bullish support zone)
• 30-Day Moving Average: 2.7040 (significant upside gap)
• RSI: 52.53 (neutral momentum, not yet overbought)
• MACD Histogram: 0.0285 (positive, indicating emerging bullish momentum)
The stock is currently trading well above all major moving averages, with the 30-day MA at $2.70 and the 200-day MA at $1.70, providing a wide margin of safety for long-term holders. The RSI at 52.53 suggests there is still room for upside before the stock becomes technically overextended. The MACD histogram turning positive at 0.0285 confirms that short-term momentum is shifting in favor of buyers. However, with no leveraged ETF data available and an empty options chain, traders must rely on price action and volume. The key level to watch is the intraday high of $9.48; a break above this resistance could trigger further short covering. Conversely, the $5.40 low serves as immediate support. Without options data to hedge or leverage, this is a pure equity momentum play.
Given the empty options chain, no specific contracts can be recommended. Traders should exercise extreme caution, as the high turnover rate suggests a potential for sharp reversals. The lack of options liquidity means that volatility will be driven entirely by spot price movements, making risk management critical.
If $9.48 resistance breaks, INLF could see a rapid extension toward the 52-week high of $4,544, though the probability diminishes with distance. Watch for volume confirmation on any breakout above $9.50.
Final Verdict: High-Risk Momentum Play Requires Strict Discipline
Inlif’s dramatic move is a testament to the power of speculative capital in the current market environment. While the long-term trend remains technically bullish relative to moving averages, the short-term volatility is extreme. Investors should treat this as a high-risk momentum trade rather than a fundamental investment. Watch for a breakdown below $5.40 or a failure to hold above $8.50 as signs of trend reversal. The contrast with the broader semiconductor sector’s value-driven buying underscores that INLF is currently trading on sentiment, not fundamentals.

TickerSnipe provides professional intraday stock analysis using technical tools to help you understand market trends and seize short-term trading opportunities.
Latest Articles
Stay ahead of the market.
Get curated U.S. market news, insights and key dates delivered to your inbox.


AInvest
PRO
AInvest
PRO




Comments
No comments yet