
INJ Breaks Out, But Volume Spike Signals Distribution at 6.00
 Aime Summary
Summary
- INJUSDT exhibits strong uptrend structure with higher highs over the past 15 days.
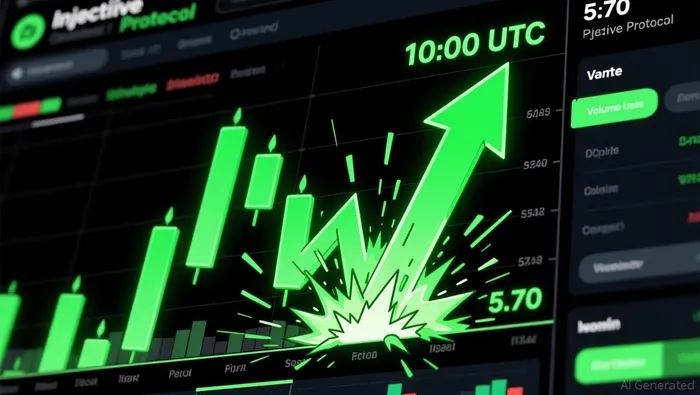
- Significant volume surge at 10:00 UTC triggered a sharp price breakout above 5.70.
- Price currently consolidates near resistance, showing mixed candlestick signals of indecision.
- 24-hour volume exceeds recent averages, suggesting active accumulation despite volatility.
- Key upside target lies near 5.90, with downside risk if support at 5.40 fails.
Market Overview
Injective/Tether (INJUSDT) closed the latest hour at 5.901, trading within a 24-hour range of 5.198 to 5.996. Total 24-hour volume reached approximately 148,500 contracts, indicating heightened market activity compared to historical averages.
1-Hour Support/Resistance and Candlestick Patterns
Price action over the last 24 hours demonstrates a clear shift from consolidation to expansion, with multiple rejections establishing key levels. The most significant resistance level identified is 5.996, where price touched but closed below, creating a long upper shadow at 12:00 UTC. Another notable rejection occurred near 5.788 at 10:00 UTC, where a bullish engulfing pattern preceded a pullback, indicating initial profit-taking. On the support side, 5.491 acted as a strong floor during the breakout phase at 10:00 UTC, holding as buyers stepped in. Additionally, 5.212 served as a critical low during the early session at 00:00 UTC, providing a base for the subsequent rally. Candlestick patterns reveal a transition from indecision to conviction; early hours featured doji and long lower shadow candles, suggesting buyer absorption at lower levels. The 12:00 UTC candle closed near its high but left a wick, signaling potential hesitation at current highs. Price is currently closer to resistance than support, as it trades near the upper end of the recent 24-hour range, suggesting immediate upside pressure may be met with selling interest.
Volume and Turnover vs. Historical Comparison
The 24-hour total volume of approximately 148,500 contracts significantly exceeds the 7-day average daily volume of 140,320 and the 15-day average of 97,171. This indicates a substantial increase in trading activity, likely driven by the recent price expansion. Specific hours with volume exceeding twice the 7-day average single-hour volume (approx. 11,693) include 10:00 UTC (14,713), 11:00 UTC (16,245), and 12:00 UTC (19,758). These spikes correlate directly with the price breakout from the 5.50 level to nearly 6.00. The volume surge at 10:00 UTC was followed by a 3-hour price increase of approximately 4.5%, confirming effective buying pressure. However, the high volume at 12:00 UTC resulted in a closed price of 5.901, lower than the 5.996 high, suggesting some distribution or lack of follow-through at the very top. This implies that while volume anomalies drove the initial price movement effectively, caution is warranted as absorption occurs at higher levels.
Look Back: Current Market Phase
The 15-day market structure clearly indicates an uptrend, characterized by higher highs and higher lows. The 7-day price change of 42.54% and the 3-day change of 21.95% confirm a strong bullish momentum. The market has moved out of any sideways consolidation or mean reversion phase, establishing a clear directional bias. The recent price action of breaking above previous resistance levels with increasing volume supports the continuation of this uptrend. However, the rapid pace of the move suggests a potential for short-term consolidation or pullback to test newly formed support levels. The current phase is best described as an accelerated uptrend, where price is testing the limits of recent highs. Traders should monitor for signs of exhaustion, such as decreasing volume on higher price attempts or failure to make new highs. The structural integrity remains intact as long as price holds above key support zones identified in the previous section.
The next 24 hours appear likely to see continued volatility as price tests the 6.00 psychological barrier. An upside break above 5.996 could target higher resistance near 6.20, while a failure to hold above 5.40 may trigger a retest of lower support levels.

Decoding market patterns and unlocking profitable trading strategies in the crypto space
Latest Articles
Stay ahead of the market.
Get curated U.S. market news, insights and key dates delivered to your inbox.


AInvest
PRO
AInvest
PRO




Comments
No comments yet