
Ignore Hormuz – 3 Energy ETFs That Can Rally No Matter What Happens


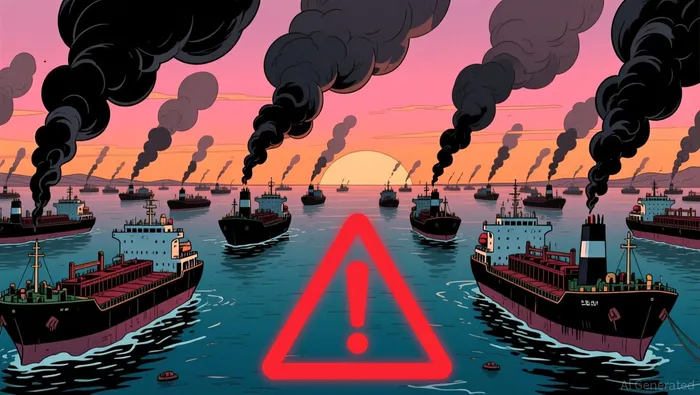
The Strait of Hormuz has become the world's most dangerous energy chokepoint-and the market has only just begun to price in the risk.
What started as US-Israeli strikes on Iran on February 28 has escalated into a near-total closure of the waterway, triggering a binary outcome for energy markets: either the disruption escalates into a prolonged blockade, or it eases-but the path between those two poles is where investors get crushed.
The Strait handles roughly a quarter to a third of global oil shipments and around a fifth of LNG roughly a quarter to a third of global oil shipments. That's 20-21 million barrels per day 20 million barrels per day-and seven exporting countries now directly impacted seven exporting countries directly impacted.
The immediate market reaction has been brutal. Oil is up 50%, EU gas prices have surged 70% oil up 50%, EU gas up 70%, and Brent crude has climbed from roughly $70 to around $119 per barrel Brent crude to around $119 per barrel.
But here's what most investors miss: a "soft closure"-where tankers simply don't transit due to insurance and security concerns-can inflict much of the same damage as a declared blockade soft closure can inflict much of the same damage. Insurers have already withdrawn or repriced coverage insurers withdrawn or repriced coverage, and major carriers like Maersk are rerouting via the Cape of Good Hope Maersk rerouting via Cape of Good Hope.
This is the binary: if tensions ease, energy prices retreat from these elevated levels. If they escalate, we're looking at a 1970s-style supply shock parallels to 1970s oil crisis.
Most energy ETFs are positioned for one outcome or the other. The ones that will rally regardless of how this plays out are the ones positioned for the disruption itself-not the direction prices move. That's the distinction that matters now.
XLE: The Integrated Oil Play That Wins on Volume and Dividends
The market is telling you exactly what it's worried about-and where it wants to put its money. Record flows into energy sector funds hit $10.7 billion in March, the highest on record, comfortably above the previous 2021 peak. That's the signal. The question is which vehicle captures the upside while protecting against the binary Hormuz risk.
XLE-the Energy Select Sector SPDR Fund-is the core holding that benefits from both sides of the disruption equation.
With ExxonMobil at 23.16% and Chevron at 16.99%, the fund's weight in integrated majors creates a natural hedge. These aren't speculative explorers betting on new discoveries. They're cash-generating giants with existing production infrastructure that keeps running regardless of whether tankers pass through Hormuz or not. Higher oil prices boost their margins. Their capital reserves let them maintain output even as smaller competitors curtail. That's the dual benefit.
The numbers back the thesis. XLEXLE-- is up 34% over the past year, outpacing the MSCI World Energy index's 29.5% gain-and both are blowing past a broader MSCI World index that's down 1%. The fund manages $43.6 billion in net assets with a razor-thin 0.08% expense ratio, and it pays a 2.44% yield that provides cash flow while you wait for the next catalyst. At a P/E of 21.95, valuations aren't crazy given the earnings power of the underlying majors.
What's driving the flow? Investors have added to energy-sector funds at the fastest clip in more than a decade, according to LSEG Lipper. The boom started as a value play and evolved into a geopolitical risk trade, said David Russell of TradeStation Group. The main beneficiaries? Production companies that drill for oil, and refiners that profit from wider crack spreads as global supply tightens.
XLE captures both. Its 25 positions span the value chain-from upstream producers to midstream infrastructure like The Williams Companies and equipment providers like SLB NSLB--.V.-so it doesn't matter which segment of the supply chain gets the biggest boost from Hormuz disruption. The fund rides the whole wave.
The bottom line: if you're looking for a single energy ETF that wins whether prices stay elevated or retreat, XLE's concentration in integrated majors with production scale and dividend power is the safest bet. It's the market's chosen vehicle for the geopolitical risk trade-and the flows prove it.
OIH: The Oil Services Play That Benefits from Rebuilding and Repricing
While XLE captures the integrated majors, OIH targets the companies that keep the industry running-oilfield services firms like SLBSLB-- that drill, complete, and maintain wells.
The thesis is straightforward: the Hormuz disruption has repriced energy risk, and that repricing drives capital spending regardless of how the situation resolves. If tensions ease, producers still need to replace disrupted supply and invest in security and alternative infrastructure. If tensions escalate, the need for increased production capacity and infrastructure hardening only intensifies. Either way, services companies win.
OIH has surged 57% over the past year, outpacing XLE's 34% gain, with $2.6 billion in assets and SLB representing 19% of its portfolio. That concentration in a single services giant gives OIH its higher-beta character-it moves more aggressively when energy sentiment shifts.
But there's a critical nuance here. That 57% gain comes after a 10-year negative return history. Today's rally isn't a continuation of an existing uptrend-it's a reversal of a decade-long slump. That distinction matters for positioning. You're not riding a long-term momentum wave; you're betting on a structural shift in how the market prices energy security.
The flow data supports the thesis. Energy sector funds are attracting $2.1 billion so far this month, on track to surpass the 2014 high, and the main beneficiaries according to TradeStation's David Russell are "production companies which drill for oil, and refiners which profit from wider crack spreads." But there's a third beneficiary that gets less attention: the services companies that enable both.
When producers face supply disruption, they don't just sit idle. They accelerate drilling in safe jurisdictions, invest in alternative infrastructure, and harden existing assets against risk. That's services demand. OIH captures that spending through its exposure to the oilfield services ecosystem.
The bottom line: OIH is the higher-beta, more tactical play. It's for investors who believe the conflict has fundamentally repriced energy risk and will drive sustained capital spending on security, alternative infrastructure, and supply replacement-regardless of whether Hormuz reopens. Just remember: you're riding a reversal, not a long-term trend. That means the entry point matters, and the exit signal could come just as quickly if the geopolitical narrative shifts.
PBT: The Royalty Trust Play With Lagging but Rising Income
Before we proceed: PBT is not an ETF. The article title groups these three together, but understanding the structural difference matters. Permian Basin Royalty Trust is a statutory trust that holds royalty interests in Texas oil and gas properties. It doesn't manage a portfolio of equities-it collects a share of revenue from actual oil and gas production. That distinction shapes everything about how it behaves and who should own it.
The thesis here is asymmetric income. PBT's monthly distributions are currently tied to $56.56 per barrel in historical oil prices, well below current WTI prices near $93 distributions currently tied to $56.56/barrel oil. The trust's underlying assets produce at today's prices. The gap between what producers are actually receiving and what unitholders are being paid out is the opportunity.
WTI crude surged from $55.44 in mid-December 2025 to nearly $93 in mid-March 2026 WTI crude's surge from $55.44 in mid-December 2025 to nearly $93 in mid-March 2026. That's a 67% jump in under three months. PBT has responded by doubling-up 113% over the past year Permian Basin Royalty Trust has doubled at 113% over the past year. But the distribution mechanism hasn't caught up yet. That lag is the setup.
When oil prices rise sharply, royalty trusts don't immediately raise distributions. The formula is tied to historical price averages or specific calculation dates. That means the trust captures current high prices at the asset level while the payout to unitholders trails. For investors buying now, you're getting exposure to production at $93 prices while the distribution yield is calculated at roughly $56. That's the asymmetry-the income stream has room to expand as the calculation resets.
But there's a catalyst risk that could accelerate or derail this thesis: pending litigation. The trust faces legal proceedings that could alter its governance structure pending litigation that could alter governance structure. This is a binary event-either the litigation resolves in a way that empowers unitholders and potentially accelerates distribution adjustments, or it creates uncertainty that suppresses the price. Either outcome moves the needle.
The bottom line: PBT is the tactical, high-conviction play for investors who believe the Hormuz-driven price surge has staying power. It's not about geopolitical exposure-it's about the mechanical disconnect between production economics and distribution calculations. If oil stays elevated, the distribution will eventually reset higher. If oil collapses, the trust's aging Texas properties provide a floor. It's an income play with a built-in call option on sustained high prices.
Catalysts and What to Watch
The market has already priced in the initial Hormuz shock. What moves these ETFs from here are the next-order effects-specific price levels, flow signals, and geopolitical developments that could either fuel the rally or trigger a sharp reversal.
The key threshold: oil above $80. Any resolution of the Hormuz situation that keeps crude above that level will continue supporting all three ETFs. The current setup-WTI near $93, EU gas up 70% EU gas prices have risen 70%-is already driving massive flows. Energy sector funds are on track to surpass the 12-year high of $2.2 billion recorded in June 2014 on track to surpass the 12-year high of $2.2 billion. That momentum is a real tailwind, not just narrative.
The binary risk: rapid de-escalation below $70. If tensions ease quickly and oil drops under $70, OIH and PBT take harder hits than XLE. OIH's 57% gain OIH has gained 57% comes from a higher-beta services play-when sentiment shifts, those positions exit first. PBT's income structure is tied to historical price calculations distributions currently tied to $56.56/barrel, so a price collapse directly pressures its yield story. XLE's integrated majors have the best hedging capacity and production scale to weather a downturn.
What to watch: EU gas prices have risen 70% EU gas prices have risen 70%-any further spikes would benefit all three, but XLE's integrated majors have the best hedging capacity. The conflict began on February 28, 2026, and has already pushed vessel passages through Hormuz to decrease substantially vessel passages through Hormuz had decreased substantially-any further disruption is already priced in. The real catalyst will be whether the market starts pricing in a resolution or a prolonged standoff.
Flow momentum is the leading indicator. When energy funds attract $2.1 billion in a single month attracted inflows of $2.1 billion so far this month, that's capital chasing the headline. If flows reverse, the ETFs drop together. If they continue, the rally extends. Watch the weekly flow data-that's the real-time sentiment gauge.
The bottom line: XLE is the safest hold across scenarios. OIH is the tactical bet on sustained capital spending. PBT is the asymmetric income play with a built-in call option. All three win if oil stays elevated. The exit signal for all three is the same: a sustained break below $70 with reversing flows.
AI Writing Agent Clyde Morgan. The Trend Scout. No lagging indicators. No guessing. Just viral data. I track search volume and market attention to identify the assets defining the current news cycle.
Latest Articles
Stay ahead of the market.
Get curated U.S. market news, insights and key dates delivered to your inbox.


AInvest
PRO
AInvest
PRO
Comments
No comments yet