
Hut 8 Plummets 8.5%: The Technical Breakdown That Signals Deeper Trouble
 Aime Summary
Summary
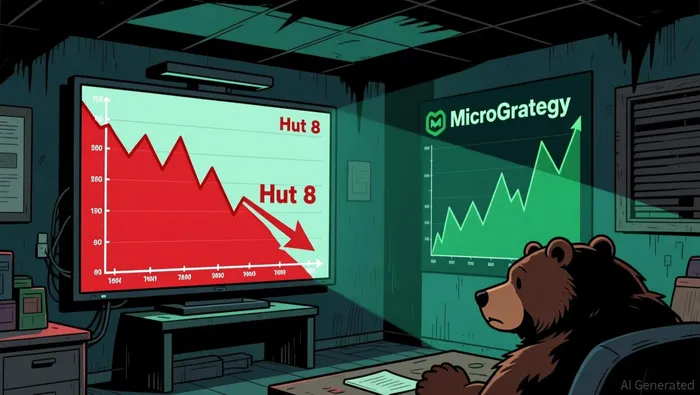
• Hut 8HUT-- (HUT) drops 8.52% intraday to $102.53, shedding significant value from yesterday’s close of $112.08.

• The stock traded in a volatile range between a low of $101.15 and a high of $110.85, failing to hold initial gains.
• Trading volume surged to 5.08 million shares, with a turnover rate of 5.08%, indicating heavy institutional and retail participation.
• Key technical support at the 30-day moving average of $106.78 has been decisively breached, raising concerns about further downside momentum.
Despite opening at $103.74, HutHUT-- 8’s inability to sustain momentum above the $110 level triggered a cascade of selling pressure. The sharp decline reflects a broader reassessment of valuation, as the stock trades at a negative dynamic PE ratio of -13.12, highlighting ongoing profitability challenges amidst its high-growth crypto-mining expansion.
Technical Breakdown and Valuation Pressure
The primary driver of Hut 8’s 8.52% intraday collapse is a confluence of technical failure and fundamental skepticism. The stock opened near the lower end of its range and failed to reclaim the critical $106.78 support level, which corresponds to the 30-day moving average. This breach signals a shift in short-term sentiment from bullish to bearish. Furthermore, the negative dynamic PE ratio underscores the market's concern over the company's ability to generate earnings relative to its current valuation. The absence of positive catalystic news and the presence of heavy turnover suggest that profit-taking and stop-loss triggers exacerbated the downward move, pushing the price toward the psychological $100 barrier.
Tech Sector Noise Overshadows Crypto Miner
Defensive Positioning and High-Leverage Puts
• 30-day Moving Average: $106.78 (Below - Resistance has flipped to overhead supply)
• 200-day Moving Average: $70.35 (Below - Long-term trend remains intact but distant)
• RSI: 57.08 (Neutral - No extreme oversold conditions yet, leaving room for decline)
• MACD Histogram: 0.92 (Positive - Momentum indicator still shows slight bullish divergence, but price action contradicts)
• Bollinger Bands: Upper $118.16, Middle $103.23, Lower $88.29 (Price is testing the middle band, a critical pivot point)
The technical setup for HUT is deteriorating. The breach of the 30-day moving average at $106.78 confirms short-term weakness, while the price hovers near the Bollinger Middle Band at $103.23. A break below this level could trigger a rapid move toward the lower band at $88.29. Traders should exercise caution; the neutral RSI of 57.08 suggests the stock is not yet oversold enough for a reliable bounce. Given the negative fundamental backdrop and technical breakdown, the bias is skewed toward the downside.
Based on the provided options chain, we identify two contracts that offer high leverage and strong sensitivity to downside moves, aligning with a bearish thesis:
• HUT20260814P90HUT20260814P90-- (Put): Strike $90, Expiration 2026-08-14. IV: 59.87% (Volatility Premium), Leverage: 30.33x (High leverage to small price moves), Delta: -0.11 (Low sensitivity, deep OTM), Theta: -0.04 (Moderate time decay), Gamma: 0.018 (High sensitivity to price changes), Turnover: $23,121 (Good liquidity). This contract offers significant leverage with reasonable volatility, suitable for a speculative bet on a sharp drop.
• HUT20260814P100HUT20260814P100-- (Put): Strike $100, Expiration 2026-08-14. IV: 115.40% (High Volatility Premium), Leverage: 14.11x (Moderate leverage), Delta: -0.43 (High sensitivity, near ATM), Theta: -0.15 (High time decay), Gamma: 0.019 (High sensitivity to price changes), Turnover: $14,216 (High liquidity). This contract is near-the-money, providing a direct hedge against further downside below $100 with substantial gamma exposure.
For a 5% downside scenario where the stock drops to approximately $97.40, the HUT20260814P90 put would see intrinsic value remain zero, but its leverage would amplify any premium changes driven by volatility and gamma. The HUT20260814P100 put would gain intrinsic value as the stock approaches the strike, offering a more direct payoff profile for a bearish move.
If HUT breaks below $100, HUT20260814P100 offers immediate downside exposure with high gamma sensitivity.
Short-Term Bearish Bias: Watch $100 Support
The 8.52% intraday drop in Hut 8 is not merely a correction but a technical breakdown that warrants caution. The loss of the 30-day moving average and the failure to hold the $106 level suggest that sellers are in control. Investors should monitor the $100 psychological support level closely; a break below could accelerate selling toward the 200-day moving average at $70.35. While the long-term trend remains bullish, the short-term risk is elevated. Market participants should also note that the sector leader, MSTR, is up 2.55% intraday, highlighting that Hut 8’s decline is idiosyncratic rather than sector-wide, likely driven by company-specific profit-taking or fundamental concerns. Watch for a sustained break below $100 or a rebound above $106 to confirm the next directional move.

TickerSnipe provides professional intraday stock analysis using technical tools to help you understand market trends and seize short-term trading opportunities.
Latest Articles
Stay ahead of the market.
Get curated U.S. market news, insights and key dates delivered to your inbox.


AInvest
PRO
AInvest
PRO




Comments
No comments yet