
Huntington Bancshares Surges 3.35% as Three-Day Rally Hits 3.91% on Bullish Technical Signals
Huntington Bancshares (HBAN) has surged 3.35% in the most recent session, extending a three-day rally with a cumulative gain of 3.91%. This upward momentum warrants a technical analysis across multiple frameworks to assess its sustainability and potential for continuation.
Candlestick Theory
The recent price action forms a bullish "three white soldiers" pattern, characterized by three consecutive higher closes with rising lows, suggesting strong institutional buying. Key support levels emerge at $16.90 (December 10 low) and $16.80 (December 8 low), while resistance is likely at $17.56 (December 10 high). A rejection at these levels could trigger a consolidation phase. A bearish divergence is noted on December 5, where a lower high and lower volume preceded a 1.17% decline, hinting at potential exhaustion if the rally extends further.
Moving Average Theory
The 50-day MA (calculated as $16.30–$16.40) and 200-day MA ($16.00–$16.10) show a bullish crossover, with the 50-day above the 200-day since mid-December. The 100-day MA ($16.20–$16.30) aligns with the 50-day, reinforcing the uptrend. The current price ($17.56) is well above all three, indicating a strong bullish bias. However, a drop below the 50-day MA could signal a short-term pullback.
MACD & KDJ Indicators
The MACD histogram has turned positive since December 3, with the MACD line crossing above the signal line, confirming a bullish momentum shift. The KDJ (Stochastic RSI) shows the %K line at 80 and %D at 75, nearing overbought territory (above 70). While this suggests a potential near-term correction, the rising %K–%D spread indicates the uptrend remains intact. A bearish crossover in KDJ would need confirmation from price action to validate a reversal.
Bollinger Bands 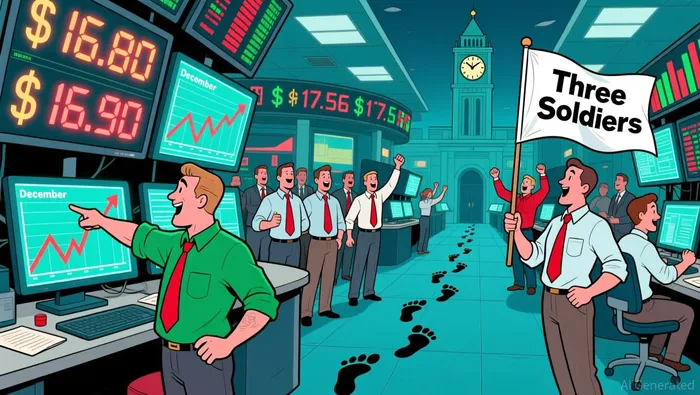 Volatility has expanded significantly, with the bands widening to $16.90 (lower) and $17.56 (upper). The current price sits near the upper band, a classic overbought signal. A retest of the lower band ($16.90) could act as a filter for short-term traders, while a break above $17.56 may trigger a continuation of the rally. The 20-period Bollinger Band width of 4.4% (vs. historical average of 3.2%) suggests elevated volatility, often preceding a consolidation phase.
Volume-Price Relationship
Trading volume has surged to 37.7 million shares (December 10), a 30% increase from the prior week’s average. This surge aligns with the price breakout above the December 5–9 range, validating the bullish move. However, volume has moderated slightly in the past two sessions, which may indicate reduced conviction if the rally persists. A sustained volume drop during an uptrend could signal weakening momentum.
Relative Strength Index (RSI)
The 14-period RSI stands at 68, approaching overbought territory (70 threshold). While this warns of potential short-term exhaustion, the RSI remains in a rising trend, consistent with the ongoing rally. A close above 70 would confirm overbought conditions, but given the strong moving average alignment and Fibonacci levels, this may merely indicate a healthy correction rather than a reversal. A drop below 50 would invalidate the immediate bullish case.
Fibonacci Retracement
Applying the 38.2%–61.8% retracement levels between the December 5 low ($16.86) and December 10 high ($17.56), key support/resistance levels are:
- 38.2% at $17.15
- 50% at $17.21
- 61.8% at $17.30
The current price of $17.56 is above the 61.8% level, suggesting a healthy extension of the rally. A pullback to the 50% ($17.21) or 38.2% ($17.15) levels would likely find buying interest, reinforcing the bullish bias.
Confluence and Divergences
The strongest confluence is the alignment of candlestick strength, moving average crossovers, and Fibonacci support at $17.15–$17.21. The RSI’s near-overbought reading and KDJ’s tight alignment suggest caution, but these are more warnings than reversal signals in a strong trend. A divergence to monitor is the MACD histogram’s potential flattening, which could precede a consolidation phase if volume fails to sustain the rally.
In summary, Huntington BancsharesHBAN-- exhibits robust bullish momentum across multiple indicators, with key support/resistance levels and confluence points reinforcing the continuation case. However, traders should remain cautious of overbought conditions and potential short-term corrections, particularly if volume wanes or the RSI crosses above 70 without a breakout above $17.56.
If I have seen further, it is by standing on the shoulders of giants.
Latest Articles
Stay ahead of the market.
Get curated U.S. market news, insights and key dates delivered to your inbox.
AInvest
PRO
AInvest
PRO
Comments
No comments yet