
HSY Surges 3.19% on Six-Day Rally as Technical Indicators Signal Overbought Momentum
Generated by AI AgentAinvest Technical RadarReviewed byAInvest News Editorial Team
Friday, Feb 6, 2026 11:15 pm ET2min read
HSY-- Aime Summary
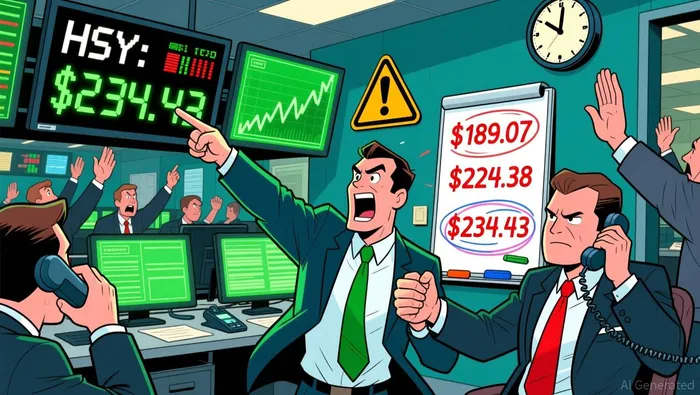
The 50-day MA (calculated at ~$208.50) and 200-day MA (~$183.20) are in a bullish "golden cross" configuration, with the 50-day above the 200-day. The 100-day MA (~$201.00) adds confluence, suggesting the uptrend is intact. However, the 200-day MA could act as a critical support level if the rally falters. A close below $208.50 would signal weakening momentum, while a sustained break above $234.43 could see the 50-day MA ascend into $215–$220 as dynamic support.
Volatility has expanded as the stock approaches the upper Bollinger Band ($234.43–$236.00 range), indicating aggressive buying. The 20-period Bollinger Band width is at a 6-month high, suggesting a potential consolidation phase or sharp correction. A close above the upper band would confirm a breakout, while a retest of the lower band ($194.00–$198.00) could act as a short-term support zone.
The Hershey (HSY) is currently trading with a 3.19% gain on the most recent session, extending a six-day rally that has driven the stock 21.51% higher. This robust short-term momentum warrants a multi-indicator analysis to assess sustainability, overbought conditions, and potential reversal signals. Below is a structured evaluation of key technical frameworks.
Candlestick Theory
The recent six-day rally features a series of higher highs and higher lows, forming a bullish "trend continuation" pattern. Key support levels are evident at $194.75 (January 30 close) and $189.07 (January 26 close), with resistance clustering near $224.38 (February 5 close) and $234.43 (February 6 high). A break above $234.43 could target $245.68 (a 161.8% Fibonacci extension from the January-February range), but a failure to hold above $224.38 may trigger a pullback to $205.79 (February 4 close).Moving Average Theory
The 50-day MA (calculated at ~$208.50) and 200-day MA (~$183.20) are in a bullish "golden cross" configuration, with the 50-day above the 200-day. The 100-day MA (~$201.00) adds confluence, suggesting the uptrend is intact. However, the 200-day MA could act as a critical support level if the rally falters. A close below $208.50 would signal weakening momentum, while a sustained break above $234.43 could see the 50-day MA ascend into $215–$220 as dynamic support.
MACD & KDJ Indicators
The MACD histogram is positive and expanding, with the MACD line (12-day EMA minus 26-day EMA) above the signal line, confirming bullish momentum. The KDJ oscillator shows %K (~82) and %D (~78) in overbought territory, suggesting a potential near-term pullback. However, the lack of bearish divergence (price highs align with oscillator highs) reduces immediate reversal risk. A drop in %K below %D may trigger profit-taking, but sustained buying pressure could extend the rally.Bollinger Bands
Volatility has expanded as the stock approaches the upper Bollinger Band ($234.43–$236.00 range), indicating aggressive buying. The 20-period Bollinger Band width is at a 6-month high, suggesting a potential consolidation phase or sharp correction. A close above the upper band would confirm a breakout, while a retest of the lower band ($194.00–$198.00) could act as a short-term support zone.
Volume-Price Relationship
Trading volume has surged during the rally, with the February 6 session seeing $885.49 million in turnover, the highest in a year. This validates the price action, as strong volume typically supports trend sustainability. However, divergences to monitor: if volume declines during subsequent uplegs while prices continue to rise, it may signal waning conviction.Relative Strength Index (RSI)
The 14-day RSI is currently in overbought territory (~78), aligning with the KDJ oscillator. While this warns of potential exhaustion, the RSI’s failure to form bearish divergences (e.g., lower highs) suggests the uptrend remains intact. A drop below 60 would likely trigger a retracement to 50–55 before resuming higher ground.Fibonacci Retracement
Key Fibonacci levels from the January 26–February 6 rally ($189.97 to $234.43) include 38.2% at $218.30 and 61.8% at $200.15. The current price near $231.53 is testing the 78.6% level ($220.80), which may act as a pivot. A breakdown below $200.15 would target $189.07 (100% retracement), while a close above $224.38 could see the stock test $245.68 (extension level).Conclusion
Confluence between bullish moving averages, expanding Bollinger Bands, and overbought oscillators suggests The Hershey’s rally is robust but nearing critical technical inflection points. While the short-term outlook remains positive, traders should monitor volume sustainability and Fibonacci levels for potential reversals. Divergences in MACD or RSI could signal a shift, but current indicators favor a continuation of the uptrend with caution near overbought thresholds.If I have seen further, it is by standing on the shoulders of giants.
Latest Articles
Stay ahead of the market.
Get curated U.S. market news, insights and key dates delivered to your inbox.
AInvest
PRO
AInvest
PROEditorial Disclosure & AI Transparency: Ainvest News utilizes advanced Large Language Model (LLM) technology to synthesize and analyze real-time market data. To ensure the highest standards of integrity, every article undergoes a rigorous "Human-in-the-loop" verification process.
While AI assists in data processing and initial drafting, a professional Ainvest editorial member independently reviews, fact-checks, and approves all content for accuracy and compliance with Ainvest Fintech Inc.’s editorial standards. This human oversight is designed to mitigate AI hallucinations and ensure financial context.
Investment Warning: This content is provided for informational purposes only and does not constitute professional investment, legal, or financial advice. Markets involve inherent risks. Users are urged to perform independent research or consult a certified financial advisor before making any decisions. Ainvest Fintech Inc. disclaims all liability for actions taken based on this information. Found an error?Report an Issue

ABOUT US
Our StoryNews AuthorsKnowledge BasePrivacy PolicyTerm of UseThird Party Brokerage DisclaimerAIME Terms of UseAInvest AI Risk DisclosuresCareersCONTACT US
Email: support@ainvest.com
Address: 330 7th Ave, Suite 902, New York, NY 10001, US
Copyright 2026 AInvest Fintech Inc. All rights reserved.
Comments
No comments yet