
HSBC Holdings Plunges 3.68%: The Silent Shakeout at 102.14
 Aime Summary
Summary
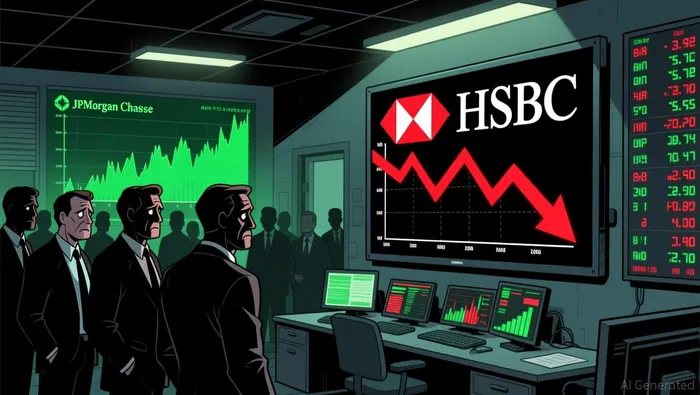
• HSBC HoldingsHSBC-- (HSBC) closes intraday at 102.14, marking a sharp 3.68% decline from the previous close of 106.04.
• Intraday trading range spanned from a low of 101.74 to a high of 102.96, with turnover hitting 1,478,041 shares.
• Technical indicators show a dynamic P/E of 12.65 and an RSI of 64.52, suggesting momentum is cooling despite long-term bullish trends.
• The stock opened at 102.00, immediately testing lower levels before a slight recovery failed to hold above 102.96.
HSBC Holdings experienced a significant intraday correction today, shedding over three percent of its value as traders reassessed positioning near key support zones. The sharp move from the previous close of 106.04 to the current 102.14 highlights increased selling pressure, yet the stock remains well above its 200-day moving average, indicating the broader uptrend is not yet broken.
Intraday Selling Pressure Tests Support Levels
The primary driver of HSBC's 3.68% intraday drop appears to be a broader market rotation or sector-specific profit-taking rather than company-specific news, as no specific corporate announcements were provided in the data. The stock opened at 102.00, essentially starting its decline immediately, and struggled to regain momentum above the 102.96 intraday high. The turnover of 1,478,041 shares suggests active participation, but the failure to hold gains indicates that buyers are stepping back at higher levels. This movement reflects a technical correction within a larger bullish structure, where short-term traders are locking in profits after recent gains, pushing the price toward the lower Bollinger Band.
Banking Sector Divergence: JPM Leads While HSBCHSBC-- Retreats
In contrast to HSBC's weakness, sector leader JPMorgan Chase (JPM) showed resilience with an intraday gain of 0.76%. This divergence suggests that the selling pressure on HSBC is idiosyncratic or related to its specific geographic exposure (Asia/Europe) rather than a systemic collapse in the banking sector. While JPM managed to push higher, HSBC's 3.68% drop highlights a relative underperformance against its US-based peers, signaling that investors may be rotating out of international bank stocks into stronger domestic alternatives or simply taking profits from HSBC's recent run-up.
Technical Analysis & Strategic Options Plays
Technical indicators present a mixed but ultimately cautious picture for short-term traders. Below are the key metrics:
• 30-Day Moving Average: 99.845 (Price is above, indicating short-term bullishness)
• 200-Day Moving Average: 85.3337 (Price is significantly above, confirming long-term bullish trend)
• RSI: 64.52 (Approaching overbought territory, suggesting potential pullback)
• MACD Histogram: 0.332 (Positive, but narrowing, indicating weakening bullish momentum)
• Bollinger Band Lower: 95.3465 (Major support zone)
The stock is currently trading near the middle Bollinger Band (101.91), having dipped below it intraday. The 30-day MA at 99.845 acts as the next critical support level. If the price holds above this average, the long-term bullish trend remains intact. However, the RSI of 64.52 suggests the stock is not yet oversold, leaving room for further short-term downside before a bounce. Traders should watch for a close below 99.84 to signal a deeper correction toward the 95.35 lower band.

Based on the options chain, we identify two contracts with strong short-term characteristics and reasonable liquidity for speculative plays:
• HSBC20260814P97HSBC20260814P97-- (Put Option)
Strike: 97 | Expiration: 2026-08-14 | Delta: -0.1577 | Theta: -0.0460 | Gamma: 0.0435 | IV Ratio: 32.76% | Leverage: 217.53% | Turnover: 940
- Delta: Sensitivity to underlying price movement.
- Theta: Daily time decay impact.
- Gamma: Rate of change of delta.
- IV Ratio: Implied volatility relative to history.
- Leverage: Potential return multiplier.
- Turnover: Trading volume value.
This put option stands out due to its high leverage ratio of 217.53% and significant gamma (0.0435), making it highly sensitive to price drops. The theta of -0.0460 indicates manageable time decay for a weekly trade. With a turnover of 940, it offers better liquidity than many other strikes. It is an ideal tool for traders betting on a continued short-term decline below 100.
• HSBC20260814C90HSBC20260814C90-- (Call Option)
Strike: 90 | Expiration: 2026-08-14 | Delta: 0.7392 | Theta: -0.4166 | Gamma: 0.0129 | IV Ratio: 148.46% | Leverage: 8.08% | Turnover: 5057
- Delta: Sensitivity to underlying price movement.
- Theta: Daily time decay impact.
- Gamma: Rate of change of delta.
- IV Ratio: Implied volatility relative to history.
- Leverage: Potential return multiplier.
- Turnover: Trading volume value.
This call option is selected for its high turnover of 5057, ensuring excellent liquidity for entry and exit. Although the leverage is lower at 8.08%, the high delta of 0.7392 means it moves closely with the stock, offering a more conservative directional bet. The high IV ratio of 148.46% suggests options are expensive, but the deep in-the-money nature reduces relative risk. This contract is suitable for traders who believe the current dip is a buying opportunity and expect a quick recovery above 102.
Payoff Calculation Primer: Assuming a 5% downside scenario from the current price of 102.14 (ST = 97.03), the HSBC20260814P97 payoff would be max(0, 97 - 97.03) = 0, indicating it is slightly out-of-the-money in this specific bearish case. However, if the drop exceeds 5%, the high gamma will accelerate profits. Conversely, the HSBC20260814C90 payoff would be max(0, 97.03 - 90) = 7.03, offering substantial profit if a bounce occurs.
Aggressive bears may consider HSBC20260814P97 if the price breaks below 101.74, while conservative bulls can use HSBC20260814C90 to hedge against a deeper drop.
Hold Firm on Long-Term Trend, Watch 99.84 Support
The current 3.68% drop in HSBC Holdings is a healthy technical correction within a broader bullish trend, as evidenced by the stock remaining well above its 200-day moving average of 85.33. Investors should not panic sell but rather watch the 30-day moving average at 99.845 as the critical support level. If this level holds, the long-term uptrend remains secure. Meanwhile, sector leader JPMorgan Chase (JPM) gained 0.76%, showing that the banking sector is not in a freefall, which supports the view that HSBC's move is isolated. Watch for a breakdown below 99.84 or a recovery above 103 to confirm the next directional move.

TickerSnipe provides professional intraday stock analysis using technical tools to help you understand market trends and seize short-term trading opportunities.
Latest Articles
Stay ahead of the market.
Get curated U.S. market news, insights and key dates delivered to your inbox.


AInvest
PRO
AInvest
PRO




Comments
No comments yet