
HOMEUSDT Spike Fails — Sellers Block the Rally
 Aime Summary
Summary
- HOMEUSDT trades near 0.0091, showing weakness after recent gains.
- Volume spiked significantly on August 6, triggering sharp price declines.
- Market structure suggests a corrective phase following a strong weekly rally.
- Key resistance at 0.0094 limits immediate upside potential.
- Support near 0.0087 provides a floor for near-term consolidation.
Severe Correction
Defi App/Tether (HOMEUSDT) closed the latest hour at 0.0091, reflecting a pullback from intraday highs. The 24-hour total volume reached 12,784,526, with turnover mirroring this activity level. Price action indicates a shift from bullish momentum to consolidation.
1-Hour Support/Resistance and Candlestick Patterns
Price action reveals a clear struggle between buyers and sellers around the 0.0094 and 0.0097 levels. The asset encountered strong rejection at 0.0097 on August 6, marked by a bearish engulfing candle followed by a long upper shadow, indicating seller dominance. A second rejection occurred near 0.0096 on August 7, where a doji with a long upper shadow suggests indecision and failed upside attempts. Conversely, support has been tested near 0.0087 and 0.0091, with the latter holding as a minor floor during the August 7 decline. The current price of 0.0091 is closer to the immediate support zone than the resistance cluster above 0.0094, suggesting a bearish bias in the short term. The presence of consecutive bearish engulfing patterns on August 6 and 7 reinforces the selling pressure, while the narrow range between 0.0090 and 0.0094 indicates a potential consolidation phase before a decisive breakout.
Volume and Turnover vs. Historical Comparison
The 24-hour total volume of 12,784,526 is significantly lower than the 7-day average daily volume of 165,919,121 and the 15-day average of 98,986,940, indicating a notable contraction in trading activity. However, specific hourly spikes stand out against the 7-day average hourly volume of approximately 6,913,296. On August 6 at 20:00, volume surged to 15,188,336, which is more than double the average, coinciding with a price drop from 0.00943 to 0.00950 (open to close) but ultimately closing lower at 0.00950 after a high of 0.00967. This high volume did not result in sustained upward movement, suggesting distribution rather than accumulation. Another significant spike occurred on August 7 at 08:00 with volume reaching 7,327,309, slightly above the hourly average, but price failed to hold gains, closing at 0.00938. These anomalies suggest that volume spikes have not effectively driven price higher; instead, they have coincided with local tops or continued declines, indicating that sellers are absorbing liquidity at these levels. The lack of follow-through on high-volume candles supports the view that buying interest is weak.
Look Back: Current Market Phase
The 7-day price change of 27.09% indicates a strong prior uptrend, but the 3-day change of -0.55% and the recent price action from highs near 0.0100 down to 0.0091 suggest a mean reversion phase. The market structure over the last 15 days shows a "higher high" pattern, but the recent decline from the peak implies a correction within a broader uptrend or a potential trend reversal. Given the sharp pullback after a significant rally, the market appears to be in a mean reversion phase, where price seeks equilibrium after an overextended move. The current consolidation between 0.0087 and 0.0097 reflects this adjustment. If price fails to hold above 0.0087, the market could shift into a downtrend characterized by lower highs and lows. Conversely, a reclaim of 0.0097 with volume could signal the resumption of the uptrend. Traders should monitor these levels closely for confirmation of the next directional move.
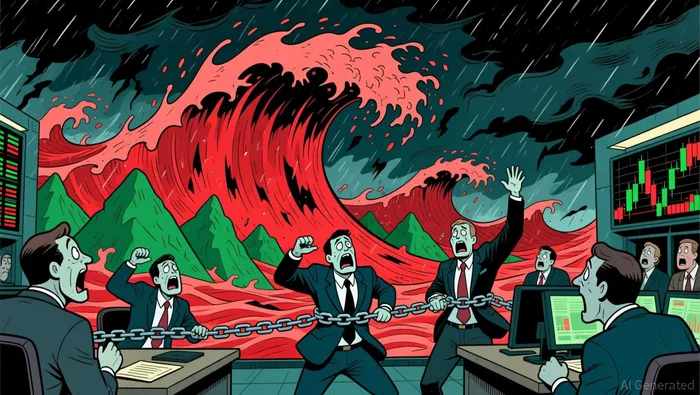

Decoding market patterns and unlocking profitable trading strategies in the crypto space
Latest Articles
Stay ahead of the market.
Get curated U.S. market news, insights and key dates delivered to your inbox.


AInvest
PRO
AInvest
PRO




Comments
No comments yet