
HEMIUSDC Crashes 9.2% on Massive Volume Spike
 Aime Summary
Summary
- HEMIUSDC crashed 9.2% in the final hour, breaking below $0.0104 support.
- Trading volume spiked to nearly $19M, exceeding the 7-day hourly average significantly.
- The asset is now in a confirmed downtrend with lower highs and lows over 7 days.
- Price sits closer to key support levels as selling pressure dominates recent action.
- A potential mean reversion bounce could occur if buying volume emerges near $0.0090.
Market Overview: Severe Liquidation Crash
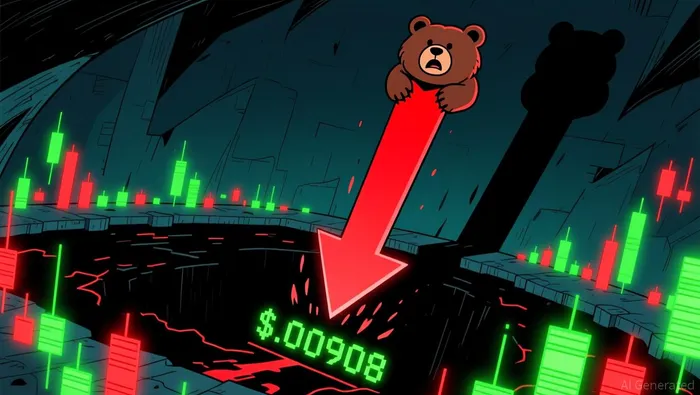
HEMI/USDC (HEMIUSDC) experienced a sharp decline, closing the latest 1-hour candle at $0.00944 after a high of $0.0104 and a low of $0.00908. The 24-hour total volume reached approximately $48.5 million, reflecting intense market activity and significant turnover as the asset shed over 9% of its value in the final hour.
1-Hour Support/Resistance and Candlestick Patterns
The 1-hour chart reveals a clear rejection at the $0.01177 resistance level, where price failed to sustain upward momentum despite multiple attempts to break higher. Conversely, the recent drop to $0.00908 establishes a new immediate support zone, with the price currently hovering just above this low. Candlestick analysis highlights a bearish engulfing pattern at the 01:00 timestamp on 2026-09-07, where the closing price of $0.00944 completely covered the prior hour's body, indicating strong seller dominance. Additionally, the previous hour showed a long upper shadow, suggesting that buyers were rejected at higher prices. The price is currently closer to the newly tested support level of $0.00908 than to the immediate resistance at $0.0104, signaling that the market structure has shifted to favor sellers in the short term.
Volume and Turnover vs. Historical Comparison
The 24-hour total volume of approximately $48.5 million is notably lower than the 7-day average daily volume of $143.2 million, indicating that the bulk of trading activity was concentrated in the final hour rather than spread evenly. However, the single-hour volume of $18.9 million at 01:00 on 2026-09-07 is significantly higher than the 7-day average single-hour volume of approximately $5.97 million, exceeding it by more than three times. This massive volume spike coincided with a 9.2% price drop, suggesting that the volume anomaly drove the price downward effectively through aggressive selling. There is no evidence of high volume with no follow-through; instead, the volume surge accompanied a decisive break below previous support levels, confirming the validity of the sell-off.
Look Back: Current Market Phase
The market structure over the last 15 days indicates a clear downtrend, characterized by a series of lower highs and lower lows. The 7-day price change of -48.13% and the 3-day change of -21.66% further confirm the bearish momentum. The 15-day daily price range of 0.02 is relatively narrow compared to the magnitude of the price drop, which suggests that the asset has been in a steady decline rather than a volatile range-bound phase. The recent sharp drop appears to be an acceleration of this existing downtrend rather than a mean reversion event, as the price has not shown signs of stabilizing or reversing direction since the initial breakdown.
The next 24 hours could see continued downside pressure as the market tests the $0.00908 support level. If this level breaks, the downside risk increases significantly towards the next key support at $0.0088. Conversely, an upside risk exists only if price can reclaim the $0.0104 level with sustained volume, suggesting a potential short-term bounce.

Decoding market patterns and unlocking profitable trading strategies in the crypto space
Latest Articles
Stay ahead of the market.
Get curated U.S. market news, insights and key dates delivered to your inbox.


AInvest
PRO
AInvest
PRO




Comments
No comments yet