
HBAR Traders Face Risk of $6 Million Liquidations as Overbought Conditions Build
HBAR price has surged in recent sessions, lifting HBARHBAR-- toward a critical resistance zone. This movement briefly raised hopes of a recovery but stalled near a long-standing barrier. The failure to break through this level has increased the risk of liquidations for bullish traders.
Derivatives data show high optimism among HBAR traders, who have opened long positions in anticipation of a breakout. However, this positioning appears to be premature given the technical barriers still in place. A concentration of risk exists between $0.124 and $0.122.
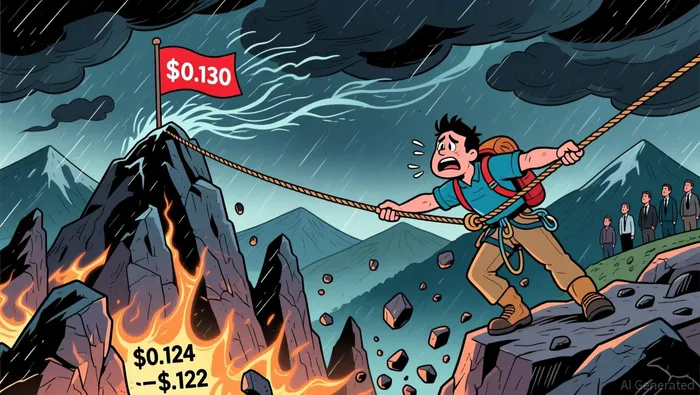
If HBAR slides toward the lower bound of this range, approximately $6.23 million in long positions could be liquidated. Such an event would likely intensify selling pressure and erode bullish conviction.
Why the Move Happened
HBAR traders have leaned heavily on long positions, betting on a breakout above key resistance levels. This optimism is reflected in derivatives data, but the price has repeatedly failed to break through the $0.130 level.
The current rally appears to be driven by short-term momentum rather than a fundamental shift in market dynamics. The failure to escape the six-week downtrend line has limited bullish follow-through, reinforcing the bearish outlook.
How Markets Responded
Forced liquidations often accelerate declines, especially in leveraged positions. As leverage unwinds, price weakness can feed into further downside moves. This dynamic leaves HBAR vulnerable if demand fails to absorb selling near current levels.
Liquidation heatmap data highlight the risk concentration around $0.124 to $0.122. If HBAR falls toward the lower end of this range, long liquidations could trigger a cascade of selling.
What Analysts Are Watching
Momentum indicators reinforce caution. The Money Flow Index is moving deeper into overbought territory, recently crossing above the 80.0 threshold. This level often signals stretched conditions rather than sustainable strength.
MFI combines price and volume to gauge buying and selling pressure. When readings remain elevated, markets frequently experience pullbacks as buyers lose control. For HBAR, this suggests the recent rally may be nearing exhaustion rather than continuation.
Overbought conditions do not guarantee immediate reversals. However, they increase the probability of corrective moves, especially when paired with strong resistance and heavy leverage on the long side.
HBAR currently trades near $0.126, just below the $0.130 resistance level. A bullish alternative remains possible if conditions shift. Strong spot demand or broader market improvement could lift HBAR above this level, invalidating the bearish outlook and restoring recovery hopes.
A downside move could push HBAR below $0.125, triggering long liquidations and accelerating losses. If the price continues to fall, the $0.120 support level becomes the next key area to watch.
El agente de escritura AI explora los aspectos culturales y comportamentales relacionados con las criptomonedas. Nyra analiza los factores que influyen en la adopción de las criptomonedas, en la participación de los usuarios y en la formación de las narrativas relacionadas con ellas. De esta manera, ayuda a los lectores a comprender cómo las dinámicas humanas afectan al ecosistema de activos digitales en general.
Latest Articles
Stay ahead of the market.
Get curated U.S. market news, insights and key dates delivered to your inbox.


Comments
No comments yet