
GWRE Just Lost 29% in a Week — Reclaiming $156 Turns the Breakdown Into a Trap
 Aime Summary
Guidewire Software (NYSE: GWRE) had its best quarter of the year and the market handed it back a quarter of its value anyway. The cloud-insurance platform beat on both revenue and earnings on Sept. 3, and by the open the next morning the stock was in freefall. The culprit wasn't the quarter — it was the guide for the year ahead, and it has turned a one-day repricing into a week-long bleed that now comes down to two numbers: $156 and $141.

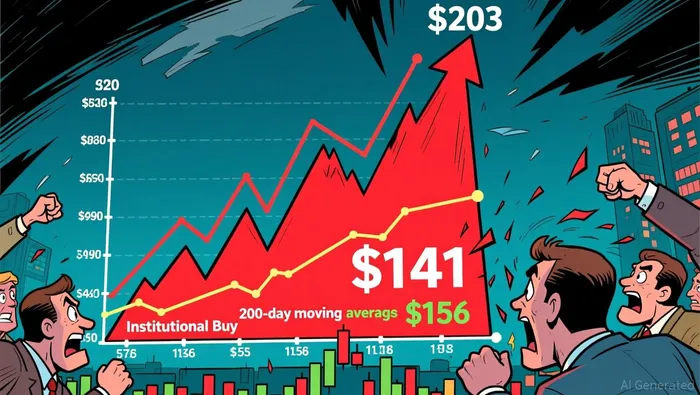
Here's the collision. GuidewireGWRE-- closed at $202.86 on the day earnings landed, then gapped lower and closed at $162.42 on Sept. 4, down about 20%. As of mid-morning trading Thursday, Sept. 10, the shares sit near $144, having carved out a session low of $141.28. That's a roughly 29% haircut in five sessions, and it has pushed the stock through both its 50-day average (near $162) and its 200-day average (near $156). The moving averages didn't cause the slide; they now mark where the trapped demand sits.
Why the market turned on a beat
For shareholders, the trap was set in plain language. Guidewire's fiscal fourth quarter, ended July 31, delivered $411.1 million of revenue, up 15% year over year, with subscription and support revenue climbing 32% to $266.7 million and non-GAAP earnings per share at $0.99. Full-year revenue reached $1.48 billion, up 23%, while annual recurring revenue (ARR) grew 19% to $1.24 billion. On the numbers alone, this was a stock that worked.
The problem is the word deceleration. Management guided fiscal 2027 revenue to $1.707–1.727 billion — about 16% growth — and full-year ending ARR to $1.45–1.46 billion, which implies ARR growth of roughly 17%, a step down from the 19% delivered in fiscal 2026. When a growth stock trades at a premium because the market assumes the cloud turn keeps compounding, a guide that says "still strong, but slower" is read as "the engine is cooling." The stock had run up into the print on AI-and-cloud momentum; the guidance pulled the valuation math out from under it.
What's easy to miss in the noise: this wasn't a broken quarter. It was a repricing from a premium growth multiple to a more modest one, all at once, in a market that hates the word "step down."
$156 is now the dividing line
Charts are contests, and this one has a clear arena. Above the 200-day average near $156, Guidewire re-enters the zone where every dip-buyer since the Sep. 4 gap is no longer underwater; below it, the sellers own the map.
Here's the mechanism to watch. Everyone who bought the "dip" at $162 on Sept. 4 is now trapped about 11% lower. The shelf between roughly $156 and $162 — the 200-day average, the 50-day average, and the first close after the crash — is now the overhead supply that has to be absorbed before any real bounce can run. That's why $156 matters as a trigger, not as decoration: reclaim it with participation, and the flush from $203 looks like a head-fake, a bear trap sprung shut on the people who sold the low. The eventual target then becomes the gap zone above, where the air pocket runs up toward the old breakdown levels.
On the other side, the line that keeps the breakdown honest is ~$141, this week's low. Below it there is no structurally meaningful shelf until much lower — the collapse from $203 to $141 happened in a straight line, so there's little traded history underneath to catch a falling knife. Losing $141 turns today's stabilization into a pause before the next leg.
The early tell: real money came back before the close
One observation about participation, not a promise: on the stabilization day so far, block-sized orders are showing net inflow (roughly $3.0 million in, versus $0.2 million out), and large orders are net positive too. That's the signature of institutional buyers testing the level, not just retail nibbling at a falling chart. It doesn't confirm a bottom — it says somebody with real size is willing to defend $141 with an order, which is exactly the kind of participation a bear-trap thesis needs to exist at all.
It's also worth remembering the stock has already given back the entire cloud-software re-rate. It sits about 44% below its 52-week high near $256 and well below where it traded the week before earnings. Most of the "bad news" is printed, priced, and public; what's left is a technical question about whether $141-144 becomes the floor.
The map that resolves it
| Scenario | Trigger | Path | Invalidation | Horizon |
|---|---|---|---|---|
| Bear trap / snap-back | Reclaim & hold ~$156 (200-day) | Fill toward the $162 shelf, then the gap above | Close back below ~$141 | Days to weeks |
| Breakdown resumes | Lose ~$141 (this week's low) | Lower prices with little on-chart support | Fails to reclaim $156 | Days |
Until one of those two breaks, the stock is in a no-man's land between $141 and $156 — too far below its broken trend line to call the selling done, and too far up from collapsed support to chase it. Hold $141 and reclaim $156, and the flush becomes the bear trap that punished the sellers at the low. Lose $141, and the verdict is that the market had one more chapter of repricing left. This setup is decided by price, not opinion — and the deciding bar is probably no more than a few sessions away.
Data as of Thursday, Sept. 10, 2026, intraday. Technical levels derived from live market data and are analytical judgment, not a recommendation.

Stay ahead of the market.
Get curated U.S. market news, insights and key dates delivered to your inbox.


AInvest
PRO
AInvest
PRO




Comments
No comments yet