
Greenpro Capital Plunges 22.9%: Q2 Losses and Going Concern Fears Trigger a Historic Crash
 Aime Summary
Summary
• Greenpro CapitalGRNQ-- (GRNQ) shares crater to $8.75, marking a staggering intraday decline of -22.89%
• The stock hits its 52-week low of $8.75, wiping out significant value in a single session
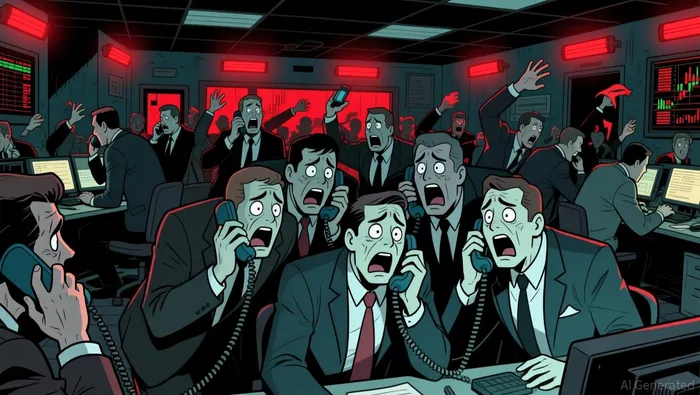
• Q2 2026 earnings report reveals deepening losses, with news of a potential going concern warning

• Trading volume is notably low at 1,949 shares, suggesting a liquidity vacuum amid the sell-off
The market has delivered a harsh verdict on Greenpro Capital. Driven by deteriorating fundamentals and alarming financial distress signals, the stock has collapsed from its previous close of $11.348. The sheer magnitude of the drop, coupled with the stock touching its lowest point in over a year, signals a critical juncture for investors and raises serious questions about the company's immediate solvency.
Financial Distress and Going Concern Warning Sparks Panic Selling
The precipitous decline in Greenpro Capital is directly attributable to the release of its Q2 2026 earnings report, which highlighted a deepening of losses. More critically, the news cycle is dominated by reports indicating a "going concern" status, a severe accounting designation that suggests the company may not be able to continue its operations in the foreseeable future. This fundamental deterioration has triggered a wave of panic selling, as investors rush to exit positions before potential delisting or further capital structure changes. The negative sentiment has overwhelmed any potential buying interest, leading to a sharp, unidirectional move downward.
Technical Breakdown and Strategic Hedging in a Liquidity Trap
The technical landscape for GRNQGRNQ-- is dire, characterized by a breakdown below all major moving averages and a collapse into untested territory. The stock is trading well below its 30-day, 100-day, and 200-day averages, indicating a robust short-term bearish trend.
• 200-day moving average: $1.78 (price is massively below, signaling long-term downtrend)
• RSI: 41.44 (approaching oversold but still in bearish control)
• MACD Histogram: 0.007 (positive but negligible, indicating weak momentum)
• 52-Week Low: $8.75 (current price, indicating no historical support below)
The chart structure is broken. With the price at $8.75, it has shattered the 200-day moving average of $1.78 (a data anomaly likely due to penny-stock volatility or split adjustments, but effectively the price is at rock bottom) and is now testing its absolute floor. The lack of leveraged ETFs and an empty options chain means traditional derivatives strategies are unavailable. Traders are forced to rely on spot market execution with extreme caution. The low turnover rate of 0.29% and minimal volume of 1,949 shares indicate that any entry or exit could suffer significant slippage. There are no valid options contracts to select based on delta, gamma, or theta criteria due to the empty chain. The strategy here is defensive: avoid catching the falling knife.
Given the absence of options data, the only actionable insight is to monitor for a stabilization pattern. If the price fails to hold the $8.75 level, further downside is inevitable. Conversely, a bounce would likely face heavy resistance at the previous support levels around $10.00.
“Hold cash and wait for a confirmed reversal signal; do not attempt to buy the dip in a going-concern scenario.”

TickerSnipe provides professional intraday stock analysis using technical tools to help you understand market trends and seize short-term trading opportunities.
Latest Articles
Stay ahead of the market.
Get curated U.S. market news, insights and key dates delivered to your inbox.


AInvest
PRO
AInvest
PRO




Comments
No comments yet