
Goldman Sachs Tops Q1 Estimates as Trading Surges, Buyback Boosts Confidence
Goldman Sachs posted a strong first-quarter earnings report, beating analyst expectations on both the top and bottom lines, as its trading divisions capitalized on market volatility while investment banking lagged. The firm reported net revenues of $15.06 billion, up 6% year-over-year, and earnings per share of $14.12, well ahead of the $12.33 consensus estimate. Net income totaled $4.74 billion, and the firm delivered a return on equity of 16.9%.
Revenue growth was driven by standout performance in Equities and Debt Underwriting, partially offset by weakness in Advisory. A new $40 billion share repurchase program was also authorized, adding a layer of confidence amid broader market unease.
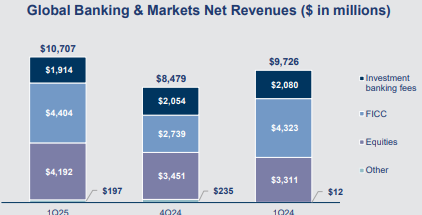
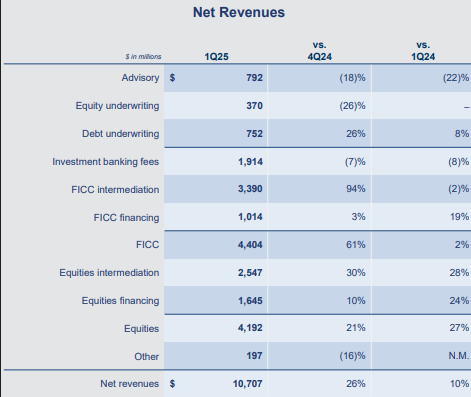
Goldman Sachs’ Global Banking and Markets division led the way, generating $10.71 billion in net revenue, up 10% from a year ago and 26% from Q4. Within this, Equities revenues soared 27% to a record $4.19 billion, led by strength in both derivatives and portfolio financing. FICC revenue totaled $4.40 billion, just below consensus but still up 2% YoY, driven by strong results in FICC financing, especially mortgages and structured lending. Equities and FICC financing both notched record quarters.
Investment Banking was the weak spot, with total fees down 8% YoY to $1.92 billion. The drop was largely due to a 22% decline in Advisory revenue, reflecting lower deal activity amid tariff-driven economic uncertainty. Equity underwriting revenue held steady, while Debt underwriting grew 7.6% to $752 million, aided by investment-grade and asset-backed issuance. Notably, the firm’s IB backlog expanded, suggesting potential improvement later in the year if market conditions stabilize.
Asset and Wealth Management brought in $3.68 billion in revenue, down 3% YoY, as asset management fees dipped slightly. Still, the bank reported $3.17 trillion in assets under supervision, an 11% increase YoY. Importantly, the quarter included $24 billion in net inflows, reversing $15 billion in outflows from the prior year. Platform Solutions swung to a pretax profit of $25 million, exceeding expectations for a loss and signaling incremental progress.
On the expense side, total operating costs rose 5.4% YoY to $9.13 billion, slightly below estimates. Compensation expenses increased 6.3%, reflecting the stronger operating environment, and the bank's efficiency ratio improved modestly to 60.6% from 60.9% a year ago. Provisions for credit losses came in at $287 million, below the $410 million estimate, mainly due to lower charges in the consumer credit card portfolio.
From a balance sheet perspective, GoldmanGBUY-- saw total deposits rise nearly 9% sequentially to $471 billion. Loans increased to $210 billion, topping estimates. The CET1 capital ratio stood at 14.8%, just shy of the 15% expectation but still solid. Book value per share rose 2.2% sequentially to $344.20, while return on tangible equity hit 18%.
The report paints a picture of a firm navigating a turbulent macroeconomic backdrop with tactical precision. Goldman’s limited exposure to traditional lending and consumer credit positions it well in an environment of recession fears fueled by Trump’s erratic tariff policy. Trading continues to serve as a core profit engine, particularly during times of volatility, while the downturn in advisory and asset management reflects the broader risk-off tone.
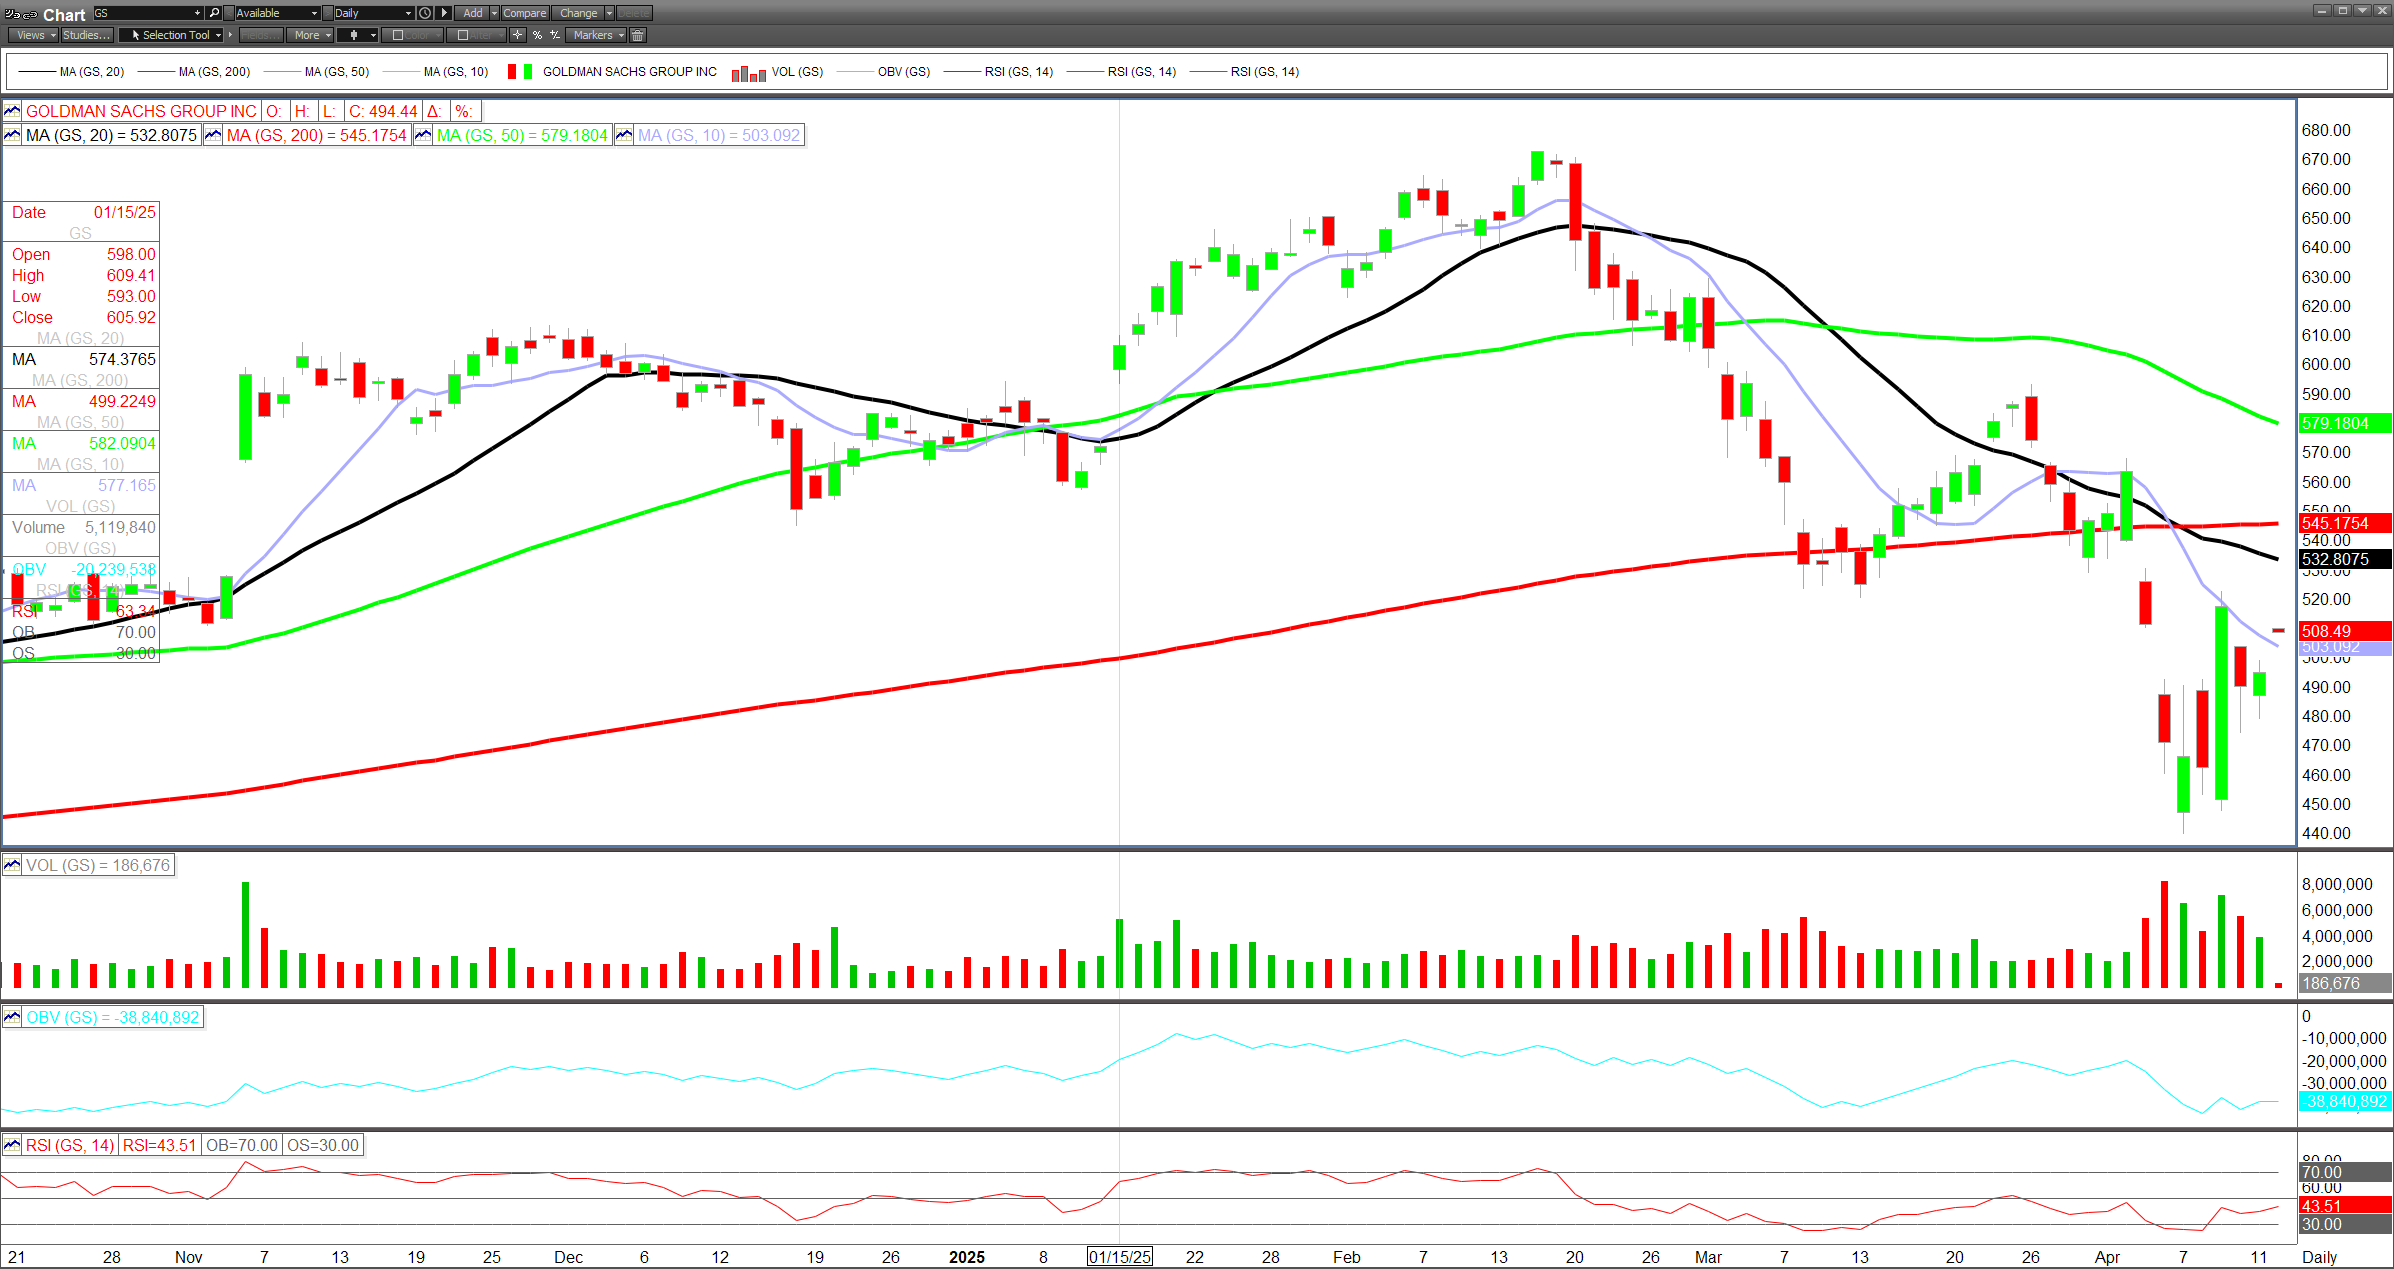
Technically, GSGS-- shares are attempting to reclaim the psychologically important $500 level after falling sharply from $670 in February to a low near $450 last week. The 20-day moving average at $532 and 200-day at $545 represent significant resistance zones. While the environment remains headline-driven and choppy, the $40 billion buyback authorization provides downside support. For now, Goldman appears well-positioned to outperform peers more heavily tied to credit and retail banking as markets adjust to the new trade paradigm.
Senior Analyst and trader with 20+ years experience with in-depth market coverage, economic trends, industry research, stock analysis, and investment ideas.
Latest Articles
Stay ahead of the market.
Get curated U.S. market news, insights and key dates delivered to your inbox.


AInvest
PRO
AInvest
PRO
Comments
No comments yet