
Gold Rally May Just Be Getting Started: Is This the Breakout That Sticks?
Gold just did the thing bulls have been waiting on for months: it punched through $3,500/oz to set fresh all-time highs, peaking around $3,508 today (September 2, 2025) before easing slightly. That level isn’t just a round number—it’s the line many technicians use to separate “range” from “run.” Earlier in the year, gold briefly tagged $3,500 intraday and faded; today’s push resets the ceiling.
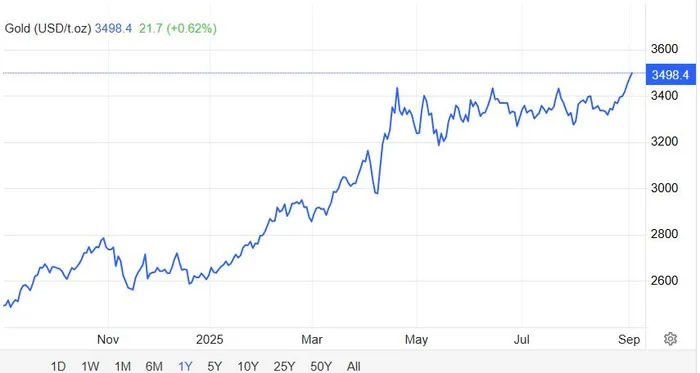
Source: tradingeconomics.com
Why it’s happening now
Two forces are doing the heavy lifting. First, macro: rate-cut odds have crept higher, the dollar has softened at the margin, and geopolitical/sovereign-risk hedging remains front and center—classic tailwinds for bullion. Second, structural buying: central banks have kept accumulating (net +123t in 1H), while ETF demand has re-accelerated alongside price strength. Together, that’s a combustible mix for new highs.
The ETF bid is big—and broad
Flows tell the story. Global gold ETF inflows are about $44B year-to-date—on pace to rival the best years on record—with North America contributing roughly $22B through July (almost entirely U.S. funds). That’s real money, and it’s increasingly sticky. Performance mirrors the flows. Among low-fee choices, SPDR Gold MiniShares (GLDM) is up ~31.6% YTD through August, outpacing most stock and bond indexes in 2025. Investors looking for deeper liquidity still gravitate to GLDGLD-- and IAUIAU--, which have captured a large share of this year’s inflows.
The $3,500 Barrier: Technical Implications
Gold’s ability to break through the $3,500 resistance level is critical for the direction of its price. The metal has tested this threshold before, only to pull back sharply. If gold fails to close and hold above $3,500, it risks falling back toward the bottom of its recent trading band—roughly 5% lower. However, a decisive breakout could attract momentum-focused traders and institutional flows, potentially accelerating the rally further.
What to watch next
Policy path: A nearer-term Fed cut would reinforce the carry advantage of gold over cash; a hawkish surprise could dent the breakout.
Dollar & real yields: A softer dollar/real-yield drift typically extends rallies; reversals there are your early warning.
Official-sector demand: Central banks have been steady buyers; any slowdown—or fresh acceleration—matters for durability.
Bottom line
This move has better foundations than April’s head-fake: macro support + official buying + revived ETF demand. If price acceptance above $3,500 sticks, the path of least resistance remains higher and ETF vehicles like GLDMGLDM--, GLD, and IAU stand to keep absorbing flows. If not, expect another fast fade back into the prior range while the market waits for the next catalyst.
Quickly compare GLDM, GLD, IAU side by side with our ETF Compare Tool
Market Radar delivers concise, daily trading ideas by tracking everything from options activity and market sentiment to high-profile political trades.
Latest Articles
Stay ahead of the market.
Get curated U.S. market news, insights and key dates delivered to your inbox.

Comments
No comments yet