

Gold Plunges Below $4,600: Is This The Ultimate Buying Opportunity?
On Monday, February 2, the precious metals market witnessed a liquidation event not seen in over ten years. Spot gold collapsed, shedding as much as 6.3% intraday to pierce the critical $4,600 support level, trading as low as $4,557.75 per ounce. Silver was equally battered, swinging wildly and dropping toward $75 after previously climbing. The immediate catalyst was the confirmation that President Donald Trump will nominate Kevin Warsh to lead the Federal Reserve. Markets immediately priced in a regime of higher real rates and a stronger dollar, triggering a massive unwinding of crowded long positions.
However, experienced market participants recognize this volatility not as a structural break in the bull market, but as a classic "clearing event." While the initial shock of a hawkish Fed chair is potent, the underlying drivers of gold—unsustainable sovereign debt and currency debasement—remain unaltered. For investors with a medium-term horizon, this capitulation represents a high-probability entry point. The narrative has shifted momentarily from fiscal dominance to monetary restriction, but history suggests that panic-induced selloffs of this magnitude often mark significant local bottoms.
Deconstructing the Selloff: The Kevin Warsh Factor
The violence of the selloff can be attributed to the specific profile of Kevin Warsh. Traders and algorithms alike view Warsh as perhaps the toughest inflation fighter among the available candidates. Unlike his predecessors, Warsh has historically been critical of the Fed’s asset balance sheet expansion and "easy money" policies.
Upon the news, the Bloomberg Dollar Spot Index snapped back, rising 0.1% after a 0.9% gain in the previous session. The logic is straightforward: if the Fed under Warsh maintains higher interest rates to combat inflation, the opportunity cost of holding non-yielding assets like bullion increases. This triggered an immediate repricing in the bond market, lifting real yields and strengthening the greenback, which historically shares an inverse correlation with gold.
Furthermore, the trade was undeniably crowded. As noted by independent market commentators, gold had risen to all-time highs that shocked even seasoned traders, driven by Chinese speculation and call option buying. When the "Warsh news" hit, it didn't just change sentiment; it forced a mechanical deleveraging. The record wave of call options that had previously reinforced upward momentum suddenly acted as an accelerant on the way down, as dealers unwound their hedges, exacerbating the speed of the drop.
Ainvest Technical Analysis: History Favors the Brave
While the fundamental narrative is currently dominated by fear, technical analysis provides a compelling counter-argument for a bullish reversal. According to Ainvest analysis, the current market behavior matches a specific, high-probability pattern that has historically rewarded buyers.
The analysis focuses on a specific condition: a "Gold 2-Day Drop With 6% Amplitude." This filter identifies moments of extreme capitulation where price action is driven by panic rather than orderly distribution.
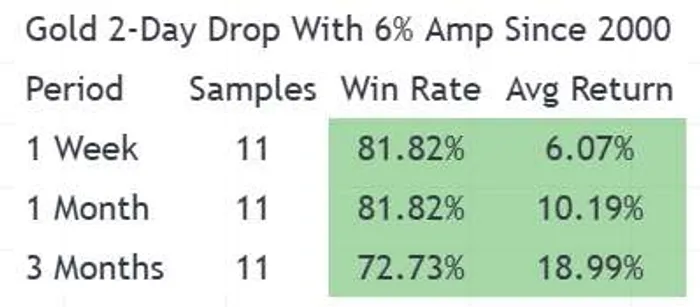
Backtesting Data (Since 2000): According to the proprietary data from Ainvest, this specific technical setup has occurred 11 times since the year 2000. The results following these crashes are overwhelmingly bullish:
- 1-Week Performance: The win rate (probability of a price increase) stands at 81.82%, with an average return of 6.07%.
- 1-Month Performance: The win rate remains steady at 81.82%, but the average return jumps to 10.19%.
- 3-Month Performance: While the win rate dips slightly to 72.73%, the average return nearly doubles to 18.99%.
Chart Analysis: Looking at the historical K-line charts provided by Ainvest, previous instances of this signal (such as during the liquidity crunches of 2008 and 2020) resulted in "V-shaped" recoveries.
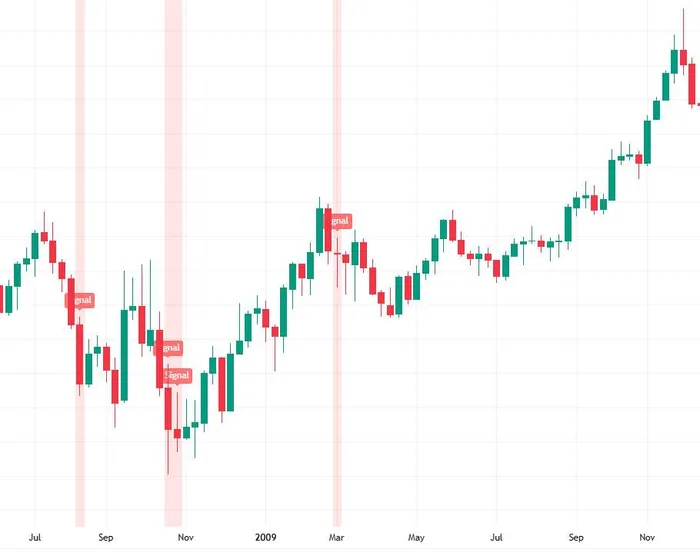
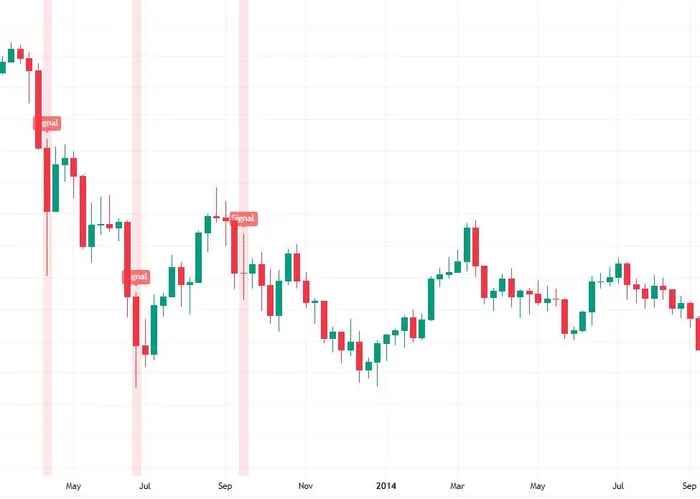
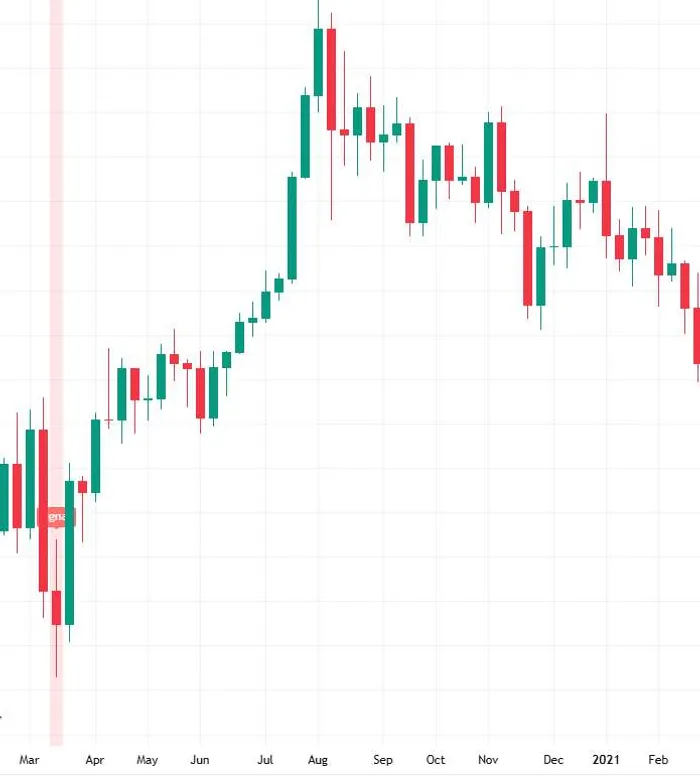
- The Pattern: The charts illustrate that when volatility expands (amplitude > 6%) and price collapses simultaneously, it usually indicates a "washout" of weak hands.
- Current Setup: The current candle structure mirrors these historical bottoms. The sheer verticality of the red candles suggests emotional selling. Statistically, the market rarely sustains a drop of this velocity without a significant mean-reversion bounce. If history repeats, a recovery back toward the $5,000 level could materialize within the quarter.
Wall Street Perspectives: A Buying Opportunity in Disguise?
Wall Street’s reaction has been mixed, but a consensus is forming that the selloff is an overreaction to personnel changes rather than a shift in economic reality.
The Bullish Majority: Analysts at Goldman Sachs maintain a constructive view, arguing that the "Fed put" may be repriced but is not dead. In a recent note to clients, they emphasized that while Warsh may talk tough on inflation, the U.S. government’s fiscal deficit—now spiraling beyond sustainable levels—will eventually force the Fed’s hand to cap yields, a scenario famously bullish for gold. "The structural case for gold as a hedge against debasement is unaffected by who sits in the Chair," the note read.
Similarly, commodity strategists at Bank of America pointed out that physical demand from central banks, particularly the PBoC (People's Bank of China), tends to accelerate during price dips. They view the drop to $4,680 not as the end of the cycle, but as a liquidity event that allows institutional players to reload long positions at a discount.
The Bearish Minority: Conversely, a minority of strategists, including those at Morgan Stanley, urge caution. They warn that if Warsh successfully implements a "Volcker 2.0" strategy, real rates could remain elevated for longer than the market anticipates. "The era of financial repression may be paused," they noted, suggesting that gold could face headwinds for the entirety of Q1 2026 until the inflation data proves otherwise. They advise waiting for price stabilization around the $4,550 level before aggressive accumulation.
Conclusion
The nomination of Kevin Warsh has undoubtedly delivered a shock to the system, flushing out leverage and shaking investor confidence. However, astute investors must separate the signal from the noise. The 6.3% plunge in gold is a reaction to a political appointment, not a change in the fiscal solvency of the United States.
Data provided by Ainvest suggests that panic selling of this magnitude is statistically one of the most reliable buy signals in the precious metals market, with an 81% historical probability of positive returns over the next month. While the days ahead may remain volatile as traders adjust to the new Fed leadership, the confluence of technical support and historical precedents suggests that $4,600 is likely a floor, not a ceiling. For those who missed the rally to highs, the market has just offered a rare second chance.
Tianhao Xu is currently a financial content editor, focusing on fintech and market analysis. Previously, he worked as a full-time forex trader for several years, specializing in global currency trading and risk management. He holds a master’s degree in Financial Analysis.
Latest Articles
Stay ahead of the market.
Get curated U.S. market news, insights and key dates delivered to your inbox.


Comments
No comments yet