

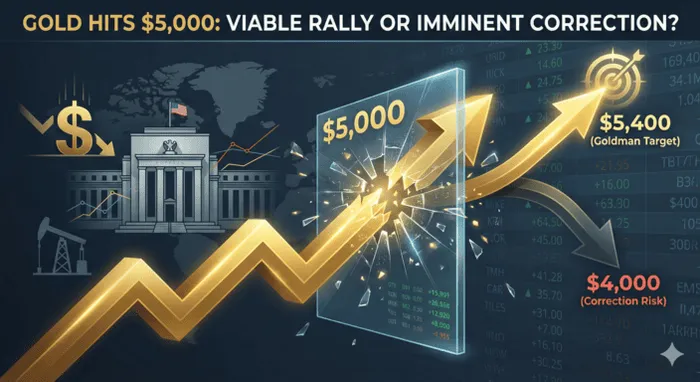
Gold Hits $5,000: Is Goldman’s $5,400 Target Viable or Is a Correction Imminent?
Takeaways:
- Historic Rally: Gold surged to an all-time high near $4,960/oz, gaining over 15% YTD, driven by a 0.8% drop in the dollar and fears over the Federal Reserve’s political independence.
- Revised Forecasts: Goldman SachsGS-- raised its year-end gold price target to $5,400 from $4,900, citing intensifying demand from private investors and central banks hedging against global policy uncertainty.
- Geopolitical Catalysts: Escalating tensions in Venezuela, Iran, and the unfolding Greenland crisis are fueling a "debasement trade," prompting capital rotation from sovereign bonds into hard assets like bullion.
Gold prices surged to a historic high near $5,000 per ounce in early Asian trading on Friday, January 23 , fueled by a confluence of a weakening US dollar and escalating concerns regarding the political independence of the Federal Reserve. Spot gold climbed 0.5% to $4,959.39 an ounce, extending a frantic rally that has seen the metal gain 15% in just the first few weeks of 2026, following its best annual performance since 1979. The catalyst for this latest leg up is US President Donald Trump’s renewed verbal attacks on the central bank, which have rattled bond markets and sent the Bloomberg Dollar Spot Index down 0.8% for the week. As investors rotate capital out of fiat currencies and sovereign bonds, the market is pricing in a "debasement trade"—a defensive maneuver against potential monetary instability. While the momentum is undeniable, the speed of the ascent suggests heightened volatility ahead as the market awaits clarity on the next Fed Chair.
The Perfect Storm: Why the Rally is Sustainable
The current rally is not merely a speculative bubble; it is underpinned by structural shifts in the global macroeconomic landscape that have intensified throughout January. The primary driver is the erosion of confidence in the US dollar as a store of value, exacerbated by the executive branch's pressure on monetary policy. When the independence of a central bank is questioned, the risk premium on that nation's currency invariably rises.
We are witnessing a clear negative correlation between the dollar and bullion. As the greenback weakens, gold becomes cheaper for holders of other currencies, spurring global demand. However, the geopolitical dimension provides a floor for these prices. Beyond the domestic monetary policy drama, the "Greenland crisis" has emerged as a significant flashpoint, adding to existing instability involving Venezuela and Iran. These geopolitical risks have reduced the appeal of traditional safe havens like US Treasuries, channeling liquidity directly into the precious metals complex.
Furthermore, the "fear of missing out" (FOMO) among institutional investors is palpable. Unlike previous rallies driven by retail speculation, data indicates substantial accumulation by central banks and private wealth funds. This institutional sponsorship suggests that the $5,000 level is viewed not as a ceiling, but as a psychological pivot point for further upside. The silver market confirms this broad-based sentiment, with silver jumping 0.7% to a record $96.91, signaling that this is a sector-wide revaluation rather than an isolated gold event.
Historical Parallels: The 1979 Analog
From a technical and historical perspective, the current market dynamics bear a striking resemblance to the late 1970s. In 1979, gold experienced a parabolic run driven by stagflation fears, an energy crisis, and a crisis of confidence in the US dollar. Today, while inflation dynamics differ, the crisis of confidence is remarkably similar.
Technical indicators suggest the market is in overbought territory, but in strong secular bull markets, assets can remain overbought for extended periods. The Relative Strength Index (RSI) on the weekly chart is elevated, yet volume remains high, indicating legitimate accumulation rather than exhaustion.
Historically, when gold breaks a multi-decade inflation-adjusted high, it tends to enter a price discovery phase where resistance levels are nonexistent. The move from $4,000 to nearly $5,000 happened faster than previous $1,000 increments, a phenomenon known as "acceleration." If we apply the Fibonacci extension levels from the last major consolidation phase in late 2025, a technical projection places the next major resistance not at $5,000, but closer to $5,250. However, investors should be wary of sharp, short-term pullbacks. In similar setups historically, a 5% to 8% correction often occurs to flush out leveraged leverage positions before the trend resumes.
Wall Street’s Verdict: The Street Chases the Price
Major investment banks are rapidly adjusting their forecasts to catch up with the market's reality. The most notable revision comes from Goldman Sachs Group Inc., which has historically been an accurate barometer for commodity super-cycles.
Goldman Sachs has lifted its year-end gold price forecast to $5,400 an ounce, up significantly from their previous estimate of $4,900. In a note to clients, analysts Daan Struyven and Lina Thomas emphasized that risks are "significantly skewed to the upside." Their rationale hinges on intensifying demand from private-sector investors who are diversifying further due to "lingering global policy uncertainty".
This bullish stance is echoed across the street, though with varying degrees of aggression. Analysts at Morgan Stanley have previously noted that real yields—the return on bonds after inflation—are the key driver for gold. With the President pressuring the Fed for more interest rate cuts, and a potential dovish Fed Chair appointee on the horizon, real yields are likely to remain suppressed or negative. This environment is the ideal "Goldilocks" scenario for non-yielding assets like gold. Conversely, Bank of America has maintained a constructive view, focusing on the central bank accumulation trend, noting that de-dollarization efforts by emerging markets continue to provide a structural bid for physical gold.
The Bearish Case: Why a Reversal to $4,000 Is Possible
While the consensus is euphoric, prudent investors must examine the growing risks of a severe correction. Not all analysts agree with the parabolic trajectory to $5,400; in fact, several authoritative voices are flashing warning signals that the trade is overcrowded and priced for perfection.
Robin Bhar, founder of Robin Bhar Metals Consulting, offers a starkly contrarian view, forecasting that gold prices could average closer to $4,000 this year, with potential support levels tested as low as $3,500. The bearish argument here is grounded in "demand destruction": at $5,000/oz, physical jewelry demand in price-sensitive markets like India and China may collapse, removing a critical floor for the market. Indeed, domestic prices in India have already seen corrections due to profit-booking, signaling that physical buyers are balking at these record levels.
Furthermore, analysts at Wells Fargo maintain a more conservative forecast range of $4,500 to $4,700, implying a roughly 10% downside from current levels rather than further gains. The key risk catalyst is the Federal Reserve. As noted by IG International, if the Fed proves unexpectedly hawkish—or if tariffs reignite inflation that forces interest rates higher rather than lower—real yields could spike. Historically, a sharp rise in real yields has been the most reliable "cooler" for gold rallies. With technical indicators screaming "overbought" and the "margin for disappointment" growing, a resolution of geopolitical tensions or a Supreme Court ruling limiting tariffs could rapidly unwind the risk premium, triggering a violent mean reversion toward the $4,000-$4,500 range.
Conclusion
The test of $5,000 marks a definitive inflection point for the precious metals complex. While the momentum behind the "debasement trade" provides strong support for Goldman’s $5,400 trajectory, the growing divergence between financial speculation and physical demand destruction creates a fragile foundation. The market is now effectively caught between a political tailwind—uncertainty over the Fed—and a fundamental headwind—buyers striking at record prices. Consequently, the "easy money" phase of the rally appears to be over. For US market participants, the prudent strategy is no longer aggressive accumulation of spot gold, but rather a strategic rotation into high-margin miners or utilizing options to hedge against a potential mean reversion to the $4,500 levels. The secular bull market remains intact, but at these altitudes, volatility is the only guarantee.
Tianhao Xu is currently a financial content editor, focusing on fintech and market analysis. Previously, he worked as a full-time forex trader for several years, specializing in global currency trading and risk management. He holds a master’s degree in Financial Analysis.
Latest Articles
Stay ahead of the market.
Get curated U.S. market news, insights and key dates delivered to your inbox.

Comments
No comments yet