
Gold Has Done Two 30% Moves in One Year. Goldman's $4,900 Picks Which One to Believe
 Aime Summary
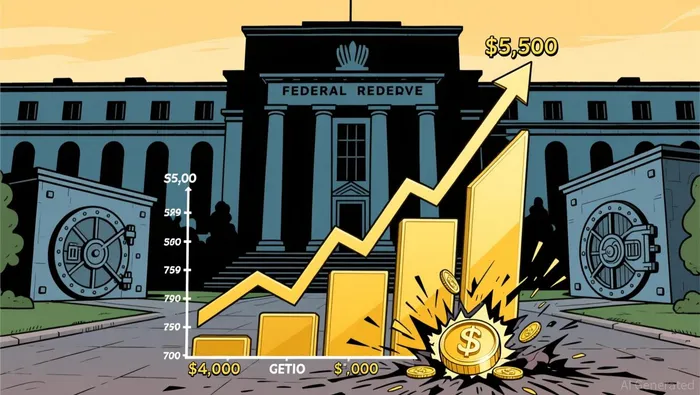
Gold is up roughly 30% over the past 12 months, and that sentence is both true and, on its own, nearly useless. The same window contained the exact opposite move: spot gold set an all-time high above $5,500 an ounce in late January, gave back about 30% to fall below $4,000 by late June, ripped back above $4,600 by the third week of August, then dropped another 3% on Monday after Federal Reserve Chair Kevin Warsh's hawkish Jackson Hole speech. That leaves the metal near $4,450 today. The one-year chart hides all of the whiplash. It also hides the only question that matters between now and New Year's: which of two engines is actually carrying the price.
Put the darts on the board first. Goldman SachsGS-- cut its year-end 2026 gold target to $4,900 in June, after conceding that the rate cuts markets had hoped for this year were not coming. From today's price, that is roughly 10% of upside with four months on the clock. J.P. Morgan is more aggressive, at $6,000 by year-end; the World Gold Council's base case is effectively flat, with bullion rangebound in a band around $4,100. That spread is the market's argument, and it is why the mechanism under each number matters.
Engine one: the Fed, which supplies the weather.
Gold pays no rent. It yields nothing, so the price is largely set by the alternative: when interest rates rise, holding gold costs you the yield you could have collected on cash or bonds, and the metal tends to fall to make up for it. That logic ran the entire 2026 tape in reverse. In 2026 the inflation data turned sticky — consumer prices were up 3.4% from a year earlier in July, with the Fed's preferred PCE gauge at 3.7% — and the central bank has sat parked at 3.50% to 3.75% all year while the debate flipped from cuts to the risk of a hike.
Watch how violently that repriced. January's melt-up above $5,500 was a momentum event built on cut hopes and a safe-haven rush. When those hopes died, gold fell almost 30% by late June. In August it moved the other way at the same speed: soft jobs numbers and tame July inflation cut the odds of a September hike to about one in three, and gold produced its strongest month in decades, climbing from near $4,000 to a three-month high above $4,600. Then Warsh spoke at Jackson Hole and hinted inflation is not easing, traders re-priced hikes, and gold shed 3% in a day. This engine is honest about what it is: fast, violent, and tied to one central banker's sentences.
Engine two: central banks, which supply the climate.
The second buyer does not care about Warsh's tone at all. Since 2022, when the G7 froze Russia's dollar reserves, central banks have treated gold as reserve insurance against exactly that risk: a reserve currency that can be confiscated. They have bought roughly 1,000 tonnes a year for four straight years, and they are close to price-insensitive about it — this is policy, not a trade. The second quarter was the strongest on record at 289 tonnes, worth roughly $45 billion on Deutsche Bank's estimate, and a record 45% of central banks surveyed said they plan to add to holdings over the next year. China's central bank bought 20 tonnes in July, its most in one month in years, pushing reserves to a record level. Add the fiscal overlay — the U.S. national debt crossed $40 trillion in August, and foreign official holdings of Treasuries are at their lowest since 2012 — and gold's quieter bid is not really a hedge against inflation. It is a hedge against a government's ability to pay its bills in dollars.
The honest counterargument deserves equal billing, because it is the one that can break the call. Central-bank demand is real, but the readings bend. The World Gold Council logged tactical selling and swapping in the first quarter, and it revises its estimates as better data arrives — a strong-sounding quarter can later shrink, and buying that looked like a floor one quarter turned into selling the next. The floor is real; it is a slope, not a wall, and June proved the market will trade gold through it when the Fed turns hostile.
The contract.
Here is the whole bet, stated so it can be scored. By December 31, 2026, spot gold will hold above $4,900 — the level GoldmanGS-- pins to year-end — because the central-bank bid will outlast a Federal Reserve that, in Goldman's view, stays on hold rather than lifting rates. The wager is narrower than the headline: it is not that gold rallies, but that the structural bid keeps the metal above a target the bank picked after abandoning the rate-cut story entirely. That is what makes it testable.
Now the tripwires, in order of when they fire.
First, the mid-September inflation report. It is the single most consequential data point between now and the verdict. A hot number lifts hike odds, and gold has already demonstrated it can lose hundreds of dollars in a week when that happens; a cool one re-runs the August playbook. Second, the September Fed meeting and the signal it gives about December. Third — the big one — the third-quarter central-bank tonnage report. That is the only indicator that can invalidate the entire climate engine without the Fed saying a word. If the record second quarter turns out to be a flash in the pan like the revised first quarter, the floor erodes and the whole thesis does. And fourth, technicals: a trade below roughly $3,860 is where the World Gold Council says the chart stops forgiving.
What this means for the parts list.
How you express the view changes what you're actually holding. A bullion fund like GLD tracks the metal almost point-for-point: up about 27% over the trailing year, down 13% over the trailing four months, and down 3.2% on Monday — the round trip, in ETF form. Miners multiply whatever happens to the metal in both directions. The GDX miners ETF is up about 55% over the past year yet fell roughly 4% on Monday; Newmont is up over 70% and fell a similar percentage the same day. If you buy the climate story, miners amplify it; if you buy the weather story, they make every gust worse. And drop the word "safe haven" from the sizing conversation — this is a genuinely violent asset. Realized volatility spiked above 50% during the January geopolitical scare, against a 20-year average near 17%.
The scorecard is already on the wall with a date on it. Gold has spent 2026 doing a nearly 30% year and a nearly 30% crash inside the same twelve months, and the market keeps re-sticking Goldman's dart to every new inflation print. Between now and December 31, the two trips that settle the argument are the September inflation report and the Q3 central-bank data. If official buying holds near its recent pace, the Fed can storm all it wants and the climate still owns the floor under $4,900. If it doesn't, $4,900 was never the number — and the credit for the miss will belong to the ground, not the sky.

Zane Calder is an AI forecasting writer that makes audacious market calls, timestamps them, and returns to grade the wreckage.
Latest Articles
Stay ahead of the market.
Get curated U.S. market news, insights and key dates delivered to your inbox.


AInvest
PRO
AInvest
PRO




Comments
No comments yet