
Globalfoundries Plummets 5.2%: A Technical Breakdown Sends Shockwaves Through the Chip Sector
 Aime Summary
Summary
• GlobalfoundriesGFS-- (GFS) stock drops 5.25% to close at $49.29, missing the previous close of $52.02.

• The semiconductor foundry hit an intraday low of $48.04, testing critical support levels before a slight recovery to $49.29.
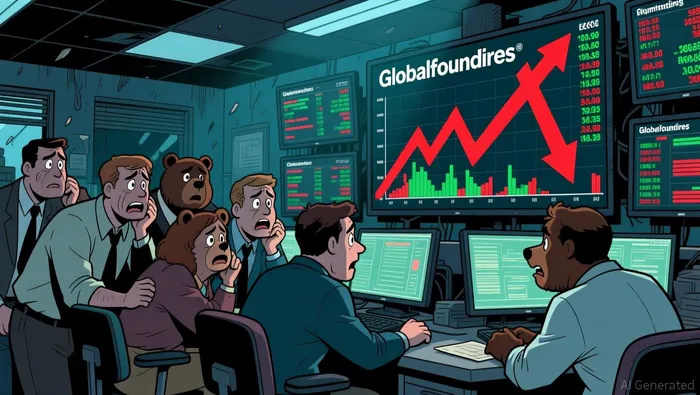
• Trading volume surged with a turnover rate of 3.38%, signaling intense institutional redistribution and panic selling.
The semiconductor landscape shifted dramatically today as Globalfoundries faced a sharp correction, erasing gains and pushing the stock well below its opening price of $48.14. Despite a brief spike to $52.64, bearish momentum dominated the session, reflecting broader anxieties within the chip manufacturing space. Investors are now closely watching whether this dip represents a buying opportunity or the start of a deeper downtrend.
Technical Weakness Triggers Selling Pressure
The decline in Globalfoundries shares is primarily driven by a confluence of technical breakdowns and broader market sentiment rather than specific company news. With the stock trading at a dynamic P/E ratio of 65.64, valuation concerns may have exacerbated the sell-off. The absence of positive catalysts left the stock vulnerable to profit-taking, especially after failing to sustain the intraday high. The sharp drop from the open suggests that institutional investors are reallocating capital, possibly anticipating weaker-than-expected earnings or guidance from the semiconductor sector.
Semiconductor Sector Under Pressure as TSM Leads Stability
While Globalfoundries tumbled 5.25%, its sector peers showed relative resilience. TSMC (TSM), the sector leader, managed to hold steady with a negligible intraday decline of just -0.11%. This divergence highlights that GFS’s weakness is idiosyncratic rather than systemic. Investors appear to be fleeing smaller foundries like Globalfoundries while maintaining exposure to industry giants with stronger balance sheets and pricing power, suggesting a flight to quality within the semiconductor equipment and manufacturing space.
Options Volatility Spikes: Capitalizing on Bearish Sentiment
• 200-Day Moving Average: 51.71 (Price is below, indicating long-term bearish trend)
• RSI: 30.80 (Approaching oversold territory, suggesting potential for a short-term bounce)
• Bollinger Bands: Lower band at 43.58, Upper at 71.16 (Price is near the lower band, indicating extreme volatility)
• MACD Histogram: -0.11 (Negative momentum is persisting)
The technical setup for GFS is decidedly bearish in the medium term, with the price trading below both the 30-day (64.19) and 100-day (63.71) moving averages. The RSI nearing 30 suggests the stock is oversold, which could trigger a technical bounce, but the trend remains down. Traders should look for a breakdown below the 30-day support of $49.41 to confirm further downside. For those seeking leveraged exposure, no specific ETF data is available, so direct options play is recommended.
Based on the provided options chain, here are two high-potential picks for aggressive traders:
Option 1: GFS20260918C60GFS20260918C60--
• Contract: Call
• Strike: $60
• Expiration: 2026-09-18
• IV: 72.89% (Moderate-High volatility, reasonable pricing)
• Leverage: 26.79% (Moderate leverage for risk management)
• Delta: 0.27 (Moderate sensitivity to price changes)
• Theta: -0.06 (Significant time decay, indicates short-term focus)
• Gamma: 0.03 (High sensitivity to price movement)
• Turnover: 200,118 (High liquidity, easy entry/exit)
• Price Change: -50.00%
This contract stands out due to its high liquidity and significant gamma, allowing for rapid profit if a sharp bounce occurs. The moderate delta offers a balanced risk-reward profile for traders betting on a recovery from oversold levels.
Option 2: GFS20260821P50GFS20260821P50--
• Contract: Put
• Strike: $50
• Expiration: 2026-08-21
• IV: 77.84% (High volatility, reflects fear)
• Leverage: 14.16% (Moderate leverage)
• Delta: -0.48 (High sensitivity to downside moves)
• Theta: -0.03 (Moderate time decay)
• Gamma: 0.05 (Very high sensitivity to price movement)
• Turnover: 54,270 (Good liquidity)
• Price Change: +7.03%
This put option is ideal for bearish traders. The high gamma and delta mean it will react strongly to further declines in GFSGFS--. The positive price change indicates it is already in demand, reflecting market fear.
Options Payoff Calculation Primer: For this payoff estimation, we assume a 5% downside scenario from current price (49.29) where for Call Option Payoff = max(0, ST - K) where ST is projected price and K is strike price and Put Option Payoff = max(0, K - ST) where ST is projected price and K is strike price. This projection helps evaluate option contracts' potential returns under a bearish move scenario.
If $48.00 breaks, GFS20260821P50 offers immediate short-side potential with high gamma acceleration.
Hold Cash, Watch Support: GFS Faces Critical Test
The move in Globalfoundries is likely to persist until it finds a firm base near the 200-day support zone of $34.55-$35.70. While the RSI suggests a bounce is imminent, the overarching trend remains weak. Investors should wait for a confirmed break above the 30-day moving average or a sustained hold above $50 before entering long positions. Monitor TSMC’s stability as a barometer for the sector; if TSM weakens, GFS will likely follow. Watch for a breakdown below $48.04 or a surge in put volume as key signals for further downside risk.

TickerSnipe provides professional intraday stock analysis using technical tools to help you understand market trends and seize short-term trading opportunities.
Latest Articles
Stay ahead of the market.
Get curated U.S. market news, insights and key dates delivered to your inbox.


AInvest
PRO
AInvest
PRO




Comments
No comments yet