
S&P Global Surges 3.11% on Bullish Candlestick Patterns Conflicting Moving Averages Signal Mixed Outlook
Generated by AI AgentAinvest Technical RadarReviewed byAInvest News Editorial Team
Friday, Feb 13, 2026 8:25 pm ET2min read
SPGI-- Aime Summary
The MACD histogram has expanded into positive territory, reflecting growing momentum, while the signal line (9-day EMA) remains below the MACD line, reinforcing bullish bias. The KDJ stochastic oscillator, however, shows overbought conditions (K=85, D=78), with a bearish divergence forming as prices rise while the K-line declines. This divergence may indicate near-term exhaustion, particularly if the RSI (see below) confirms overbought territory.
S&P Global (SPGI) has surged 3.11% in the most recent session, extending its two-day rally by 4.81%. This sharp move follows a period of volatility marked by significant intraday swings, including a 9.71% drop on February 10 and a 11.27% decline on February 3. The price action reflects a tug-of-war between buyers and sellers, with recent momentum favoring bullish participants.
Candlestick Theory
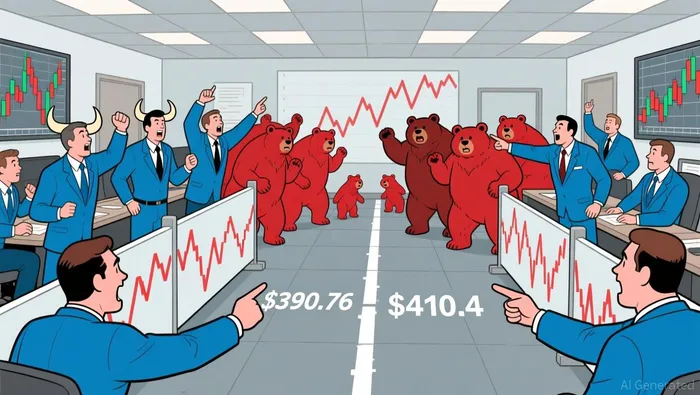
Recent candlestick patterns suggest aggressive buying pressure, particularly in the last two sessions, where long green bodies and minimal shadows indicate strong conviction. Key support levels emerge around $390.76 (February 11 close) and $381.605 (February 12 low), while resistance is clustered near $410.4 (February 13 high) and $401.08 (February 10 close). A bullish engulfing pattern on February 13, following a bearish harami on February 12, highlights a potential short-term reversal from prior bearish exhaustion.Moving Average Theory
Short-term momentum aligns with the 50-day moving average ($465.51), which remains above the 200-day average ($499.86), suggesting a bearish bias in the longer term. However, the 10-day MA ($409.54) crossing above the 50-day MA implies a temporary bullish tilt. This "death cross" for the 50/200-day MA and "golden cross" for the 10/50-day MA signal conflicting signals, with price currently testing the 50-day MA as dynamic support. MACD & KDJ Indicators
The MACD histogram has expanded into positive territory, reflecting growing momentum, while the signal line (9-day EMA) remains below the MACD line, reinforcing bullish bias. The KDJ stochastic oscillator, however, shows overbought conditions (K=85, D=78), with a bearish divergence forming as prices rise while the K-line declines. This divergence may indicate near-term exhaustion, particularly if the RSI (see below) confirms overbought territory.
Bollinger Bands
Volatility has spiked, with the bands widening from a narrow contraction on February 1. Prices currently trade near the upper band ($410.4), suggesting a potential reversion toward the 20-day moving average ($409.54), which coincides with the recent close. A break below the middle band ($405.0) would signal a return to range-bound trading, while a sustained move above the upper band may require renewed conviction.Volume-Price Relationship
Trading volume surged to $1.93 billion on February 13, validating the recent rally. However, volume on February 12 ($2.12 billion) was higher despite a smaller price gain, hinting at potential divergence. This mixed signal suggests buyers are active but may be facing increasing resistance. Sustained volume expansion above $1.9 billion would strengthen the case for a continuation, while a drop below $1.7 billion could indicate waning momentum.Relative Strength Index (RSI)
The 14-day RSI stands at 68, approaching overbought territory. While this does not guarantee a reversal, it aligns with the KDJ divergence and suggests caution. A close above 70 would confirm overbought conditions, but given the recent volatility, a bearish correction to the 50-level ($47) is more probable. A failure to break above 70 may precede a pullback toward the 30-level ($390), where key support resides.Fibonacci Retracement
Key Fibonacci levels derived from the February 3 low ($390.76) to the February 2 high ($527.66) include 38.2% ($453.5), 50% ($459.2), and 61.8% ($464.9). Prices currently test the 38.2% level, with a break above $453.5 likely to target the 50% retracement. Conversely, a drop below $453.5 could accelerate toward the 23.6% level ($447.5), offering a potential short-term floor.In conclusion, S&P Global exhibits a mixed technical landscape. Confluence between the MACD and 10-day MA suggests near-term bullish potential, but overbought RSI levels and KDJ divergence highlight risks of a near-term pullback. Traders should monitor volume sustainability and Fibonacci support/resistance levels, with a focus on whether the 50-day MA holds as a psychological floor. Divergences in momentum indicators warrant caution, particularly if volume fails to confirm higher highs.
If I have seen further, it is by standing on the shoulders of giants.
Latest Articles
Stay ahead of the market.
Get curated U.S. market news, insights and key dates delivered to your inbox.
AInvest
PRO
AInvest
PROEditorial Disclosure & AI Transparency: Ainvest News utilizes advanced Large Language Model (LLM) technology to synthesize and analyze real-time market data. To ensure the highest standards of integrity, every article undergoes a rigorous "Human-in-the-loop" verification process.
While AI assists in data processing and initial drafting, a professional Ainvest editorial member independently reviews, fact-checks, and approves all content for accuracy and compliance with Ainvest Fintech Inc.’s editorial standards. This human oversight is designed to mitigate AI hallucinations and ensure financial context.
Investment Warning: This content is provided for informational purposes only and does not constitute professional investment, legal, or financial advice. Markets involve inherent risks. Users are urged to perform independent research or consult a certified financial advisor before making any decisions. Ainvest Fintech Inc. disclaims all liability for actions taken based on this information. Found an error?Report an Issue

ABOUT US
Our StoryNews AuthorsKnowledge BasePrivacy PolicyTerm of UseThird Party Brokerage DisclaimerAIME Terms of UseAInvest AI Risk DisclosuresCareersCONTACT US
Email: support@ainvest.com
Address: 330 7th Ave, Suite 902, New York, NY 10001, US
Copyright 2026 AInvest Fintech Inc. All rights reserved.
Comments
No comments yet