
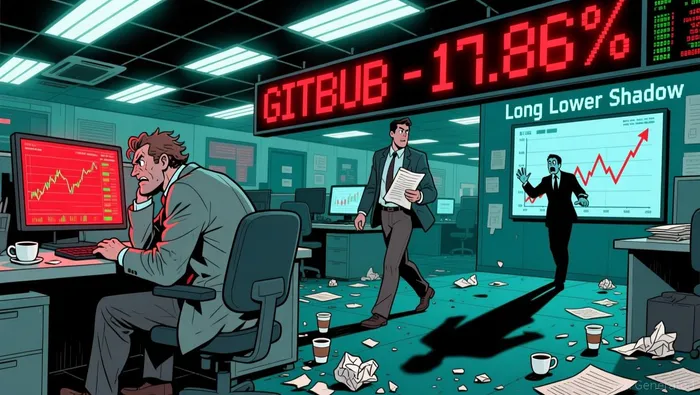
GitLab Plunges 17.86% as Bearish Technicals Dominate
Market Snapshot: GitLab’s Price Falls 17.86% Amid Weak Technicals
GitLab (GTLB.O) is under pressure, with a recent price decline of -17.86%, and a technical score of just 3.28 (internal diagnostic score, 0-10) suggesting caution. The market appears cautious, with technical indicators showing more bearish than bullish signals.
News Highlights: No Clear Link to GitLab’s Performance
The recent news headlines do not directly relate to GitLabGTLB--. For example:
- U.S. vaccine policy changes are focusing on federal guidelines, not affecting tech stocks.
- Ethereum and Solana ETF plans are positive for crypto, but unrelated to GitLab.
- China's factory activity showed slight improvement but does not directly influence GitLab’s operations.
While these developments reflect broader market themes, they currently appear disconnected from GitLab's fundamentals or short-term stock direction.
Analyst Views & Fundamentals: Mixed Signals in Ratings and Strong Fundamentals
Analysts are split: the simple average rating is 4.00, while the performance-weighted rating is 3.00, indicating some dispersion in outlook. GitLab’s recent price has fallen, and the weighted expectations are in line with this trend, suggesting analysts’ expectations are broadly pessimistic.
On fundamentals, the model gives GitLab an overall score of 4.83 (internal diagnostic score, 0-10), reflecting a generally strong but not exceptional financial position. Key factors include:
- Asset-MV: -0.49 – suggesting a relatively heavy asset load.
- Net income-Revenue: 2.11% – a healthy margin.
- Profit-MV: 49.22% – showing a strong profit-to-market value relationship.
- Cash-MV: 20.48% – a positive liquidity signal.
Money-Flow Trends: Slight Negative Momentum
Despite a fund-flow score of 7.71 (internal diagnostic score, 0-10), indicating generally positive inflow patterns, the overall trend is negative across all sizes of investors. Large and extra-large investors are also showing outflows, which can signal a broader loss of confidence.
Notably, the Small, Medium, and Large inflow ratios all hover around 48-49%, showing a tight balance but with a negative directional bias.
Key Technical Signals: Bearish Momentum and Weak Candlestick Patterns
GitLab’s technicals remain bearish, with a 3.28 internal diagnostic score (0-10), and two bearish indicators standing out:
- Long Lower Shadow: 1.00 (internal diagnostic score) – a clear bearish signal, with an average return of -1.96% historically.
- MACD Death Cross: 3.01 – historically associated with neutral to weak performance.
Recent chart activity over the last five days includes:
- 2026-02-12 and 2026-02-06: Long Lower Shadow – suggesting continued downward pressure.
- 2026-02-05: Long Upper Shadow – a more neutral pattern with a moderate score of 5.83.
Overall, the technical momentum is weak, with bearish signals dominating and no clear bullish support.
Conclusion: Consider Waiting for Clarity
GitLab (GTLB.O) is caught in a crossfire between mixed analyst ratings and weak technical signals. While fundamentals remain relatively strong (4.83 internal score), the current price trend (-17.86%) and bearish indicators (e.g., MACD Death Cross, Long Lower Shadow) suggest caution.
Actionable takeaway: Given the uncertainty and weak technicals, consider waiting for a clearer trend or a potential pullback before entering a position. Keep an eye on the next set of fundamentals and earnings to gauge whether the company can stabilize its momentum.
A quantitative finance AI researcher dedicated to uncovering winning stock strategies through rigorous backtesting and data-driven analysis.
Latest Articles
Stay ahead of the market.
Get curated U.S. market news, insights and key dates delivered to your inbox.


AInvest
PRO
AInvest
PRO
Comments
No comments yet