
Giggle Fund Volume Spike Triggers Sharp Rejection
 Aime Summary
Summary
- Giggle Fund/USDC trades in a tight range, currently testing immediate support at 37.31.
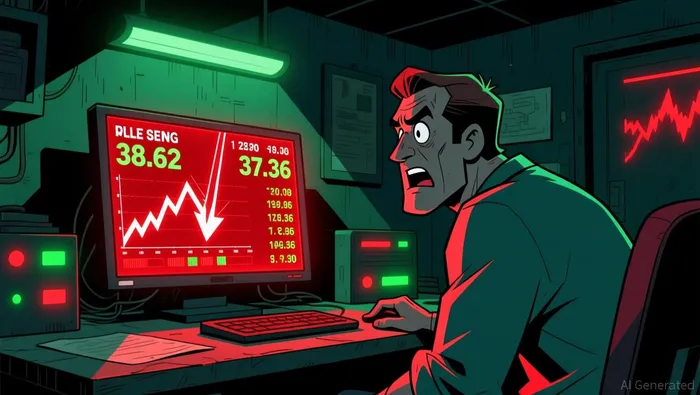
- Volume spiked significantly at 12:00 UTC, triggering a sharp price rejection and decline.
- Recent price action shows indecision with multiple doji and engulfing patterns near resistance.
- The broader market structure remains range-bound, with no clear directional breakout yet.
- Next 24 hours likely see continued consolidation unless key support levels are breached.
Market Overview
Giggle Fund/USDC (GIGGLEUSDC) closed the latest hour at 37.36, following a 24-hour high of 39.43 and low of 37.31. Total 24-hour volume was approximately 3,264 units.
1-Hour Support/Resistance and Candlestick Patterns
Price action indicates a defined trading range with resistance established near 39.14-39.43 and support holding at 37.31. The asset appears closer to the lower end of this recent structure. Candlestick analysis reveals significant indecision, specifically a doji with a long upper shadow at 15:00 UTC on September 6 and another at 09:00 UTC on September 7. These patterns suggest buyers struggled to maintain momentum above 39.00. A bullish engulfing pattern occurred at 18:00 UTC and 20:00 UTC on September 6, providing temporary upward pressure. However, the most recent hour at 12:00 UTC on September 7 displayed a long lower shadow, indicating some buying interest at 37.31, though the close remained weak at 37.36. The price is currently testing the lower boundary of the immediate range, and a break below 37.31 could expose deeper support near 36.50.
Volume and Turnover vs. Historical Comparison
The 24-hour total volume of roughly 3,264 units is slightly elevated compared to the 7-day average daily volume of 6,047 units when normalized for hourly activity, but the intraday distribution was highly skewed. The single-hour volume of 579.051 at 12:00 UTC on September 7 was notably high relative to the 7-day average hourly volume of 251.98, representing a significant spike. This volume surge coincided with a sharp price drop from 38.62 to 37.36, suggesting aggressive selling pressure. Other hours with elevated volume, such as 07:00 UTC and 08:00 UTC on September 7, showed moderate follow-through in price appreciation, but the subsequent hours failed to sustain momentum. The high volume at 12:00 UTC did not result in a sustained breakout; instead, it marked a local top, indicating that the selling pressure was effective in driving price down without immediate buyer absorption. This suggests that the volume anomaly was driven by distribution rather than accumulation.
Look Back: Current Market Phase
The 15-day market structure for Giggle Fund/USDC is characterized as range-bound. The price has oscillated between key support levels around 35.33 and resistance near 39.43, with a 15-day daily price range of 13.07 units. The 7-day price change of 2.55% and 3-day change of -6.55% reflect short-term volatility within this broader consolidation phase. There are no clear higher highs or lower lows to indicate a strong uptrend or downtrend. The market appears to be in a mean-reverting state, where price tends to revert to the center of the range after touching extremes. This phase suggests that traders should expect continued sideways movement until a decisive break of the 35.33 support or 39.43 resistance occurs.
The next 24 hours likely see continued consolidation within the 37.30-39.40 range. A break below 37.31 could trigger further downside toward 36.50, while a sustained move above 39.14 may signal a shift toward resistance testing at 39.43.

Decoding market patterns and unlocking profitable trading strategies in the crypto space
Latest Articles
Stay ahead of the market.
Get curated U.S. market news, insights and key dates delivered to your inbox.


AInvest
PRO
AInvest
PRO




Comments
No comments yet