
Giggle Fund Reverses 28% Rally as Selling Pressure Mounts
 Aime Summary
Summary
- Giggle Fund experienced a sharp reversal after a 28% three-day rally, marking a potential mean reversion phase.
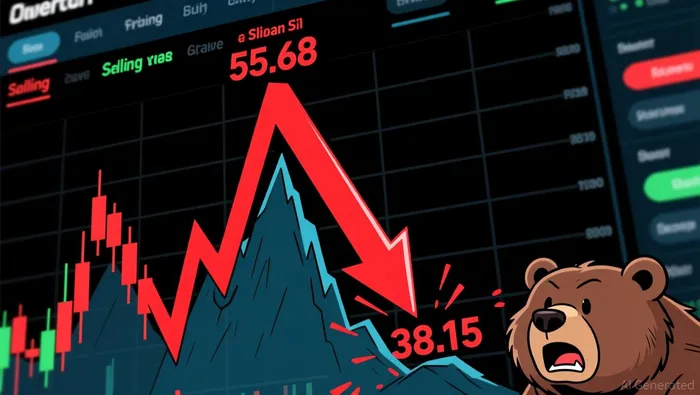
- Price dropped from 55.68 to 38.15, with heavy selling pressure evident in the final hour.
- Key support at 35.665 is now at risk as volume spikes failed to sustain upward momentum.
- Market structure appears to be shifting from a strong uptrend to a volatile correction or range-bound state.
Severe Correction
Giggle Fund/Tether (GIGGLEUSDT) saw significant volatility on 2026-08-01, closing the 12:00 UTC hour at 38.79 with a low of 38.15. The 24-hour period recorded substantial turnover, driven by extreme volume spikes that initially fueled a rally to 55.68 before a decisive breakdown. Total volume exceeded historical averages, indicating intense participation during this correction.
1-Hour Support/Resistance and Candlestick Patterns
Price action in the 24-hour window reveals a clear rejection of higher levels, with the 12:00 UTC candle showing a long lower shadow and a subsequent bearish engulfing pattern at 12:00 UTC on 2026-08-01, where the closing price of 38.79 was significantly lower than the opening of 44.16. The earlier high of 55.68 at 02:00 UTC on 2026-08-01 acted as a strong resistance level, leading to a rapid decline. Multiple candles in the 02:00 to 08:00 UTC range exhibited long lower shadows, suggesting temporary buying interest that was quickly overwhelmed by sellers. The current price of 38.79 is closer to the key support level of 35.665 than to the recent resistance at 55.68, indicating that sellers are in control. The market structure feature indicates a range bound condition over the 15-day period, but the immediate price action suggests a breakdown from the upper end of that range.
Volume and Turnover vs. Historical Comparison
The 24-hour total volume was heavily influenced by several hours where single-hour volume exceeded twice the 7-day average of 15,502.96. Notable spikes occurred at 02:00 UTC (108,378.911), 11:00 UTC (89,167.169), and 12:00 UTC (82,505.616), all significantly higher than the 7-day average. The spike at 02:00 UTC was accompanied by a large price increase to 55.68, but this was not sustained; the following 6 hours saw a continuous decline, suggesting the initial volume spike did not drive a lasting trend. The high volume at 11:00 and 12:00 UTC coincided with a sharp drop from 44.15 to 38.79, indicating that selling volume was effective in pushing prices down. This pattern suggests that volume anomalies were not supportive of upward momentum but rather facilitated a rapid correction. The lack of follow-through after the 02:00 UTC spike highlights a potential exhaustion of buying pressure.
Look Back: Current Market Phase
The 7-day price change of 41.31% and the 3-day change of 28.23% indicate a strong prior uptrend. However, the current price action, characterized by a sharp decline from recent highs and the presence of bearish engulfing patterns, suggests a mean reversion phase. The market appears to be correcting after a significant move, with price action now testing lower support levels. The 15-day daily price range of 31.05 supports the view of a volatile but structured market. The current phase is likely a transition from an uptrend to a sideways or corrective phase, as the price fails to maintain higher highs and begins to form lower lows in the short term. This suggests that the previous bullish momentum has been absorbed, and the market is seeking a new equilibrium.
The next 24 hours could see continued pressure on Giggle Fund/Tether as it tests the 35.665 support level. If this level breaks, further downside risk emerges, while a recovery above 44.00 could signal a temporary stabilization. Investors should monitor volume closely for signs of renewed buying interest or further selling pressure.

Decoding market patterns and unlocking profitable trading strategies in the crypto space
Latest Articles
Stay ahead of the market.
Get curated U.S. market news, insights and key dates delivered to your inbox.


AInvest
PRO
AInvest
PRO




Comments
No comments yet