
Giggle Fund Rejected at $45.77 as Sellers Defend Resistance
 Aime Summary
Summary
- Price consolidates near $42.20 after a sharp rejection from $45.77 highs on August 2.
- Volume spiked significantly during the early morning sell-off, indicating strong distribution pressure.
- Multiple bearish engulfing patterns suggest immediate seller dominance despite brief bullish attempts.
- Key support at $41.22 is critical; a break could trigger deeper downside toward $35.62.
- Resistance at $44.73 remains firm; failure to hold above this level signals continued weakness.
Range Breakdown and Distribution
Giggle Fund/USDC (GIGGLEUSDC) closed at $42.20 on August 2, 2026, following a volatile session that reached a high of $45.77 and a low of $39.44. The asset recorded a 24-hour total volume of approximately 13,500 USDC. This turnover reflects a market actively testing lower liquidity zones after a recent surge.
1-Hour Support/Resistance and Candlestick Patterns
The immediate market structure shows price action trapped between a strong support floor around $41.22 and a resistance ceiling near $44.73. The price has recently rejected the $44.73 level multiple times, as evidenced by the long upper shadows observed in the hourly candles during the early hours of August 2. Specifically, the candle at 05:00 UTC displayed a long upper shadow, indicating that buyers pushed price to $41.88 but were overwhelmed by sellers who forced the close near the open. Similarly, the resistance at $45.77 acted as a hard cap, with the price failing to sustain levels above $44.00 for more than a single hour. The price is currently closer to the lower end of this immediate range, hovering just above the $41.22 support threshold. Candlestick analysis reveals a dominance of bearish sentiment, with several bearish engulfing patterns appearing between 15:00 UTC on August 1 and 11:00 UTC on August 2. These patterns, where the current candle body completely covers the prior candle, signal that selling pressure is consistently overpowering buying interest. The presence of a long upper shadow at 05:00 UTC further confirms that any attempts to rally are being met with immediate supply. The market appears to be in a phase where sellers are defending the $44.00 level aggressively, while buyers are struggling to maintain momentum above $41.00.
Volume and Turnover vs. Historical Comparison
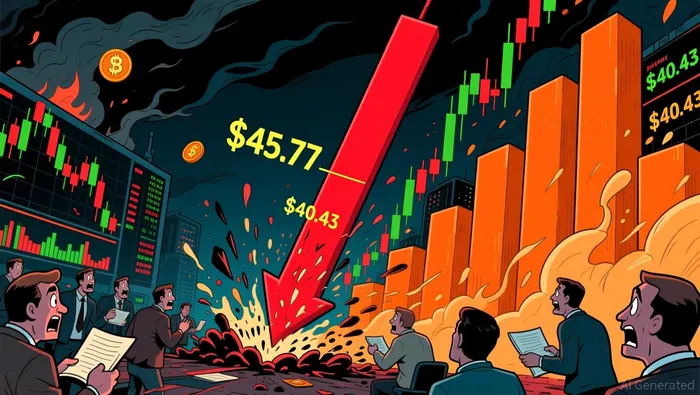
The 24-hour trading volume for GIGGLEUSDCGIGGLE-- shows significant deviation from recent averages. The average hourly volume over the past 7 days is approximately 873.82 USDC. Several hours on August 2 experienced volume spikes well exceeding twice this average. The most notable spike occurred at 01:00 UTC, where volume reached 2,377.95 USDC, nearly 2.7 times the 7-day hourly average. This spike coincided with a sharp price drop from $44.04 to $40.43, a decline of roughly 8.1% within the hour. Another significant volume event occurred at 20:00 UTC on August 1, with 1,242.138 USDC traded, accompanied by a price increase to $45.77, but this rally lacked sustained follow-through. The high volume at 01:00 UTC suggests that the sell-off was driven by genuine distribution rather than a lack of liquidity. However, subsequent hours saw lower volume, indicating that buyers are not stepping in aggressively to absorb the selling pressure. The volume anomaly at 01:00 UTC effectively drove the price down, and the lack of high volume on subsequent upward attempts suggests that the move lower has more conviction. The market appears to be distributing assets at these higher levels, with volume confirming the downward pressure.
Look Back: Current Market Phase
Analyzing the 7-day and 15-day structures reveals a complex market phase. The 7-day price change is positive at 65.36%, indicating a strong prior uptrend. However, the 3-day change is negative at -4.68%, and the 15-day daily price range is 31.07%, which is relatively wide. The market structure feature is identified as range bound, but the recent price action suggests a potential transition into a mean reversion phase following the significant prior move. The sharp decline from the recent highs around $45.00 to the current levels near $42.00, coupled with the high volume sell-off, suggests that the market is correcting after an extended rally. The presence of lower highs on the 1-hour chart since the peak at $45.77 supports the view that the immediate trend is downward. However, the broader 7-day uptrend remains intact, so this could be a deep correction within a larger bullish structure. The market appears to be in a consolidation phase where volatility is high, and participants are deciding whether to take profits or re-enter positions. The key is to observe if the price can stabilize above the $41.22 support level; a break below this could signal a shift to a more bearish short-term phase.
The next 24 hours will likely see continued volatility as the market tests the $41.22 support level. A sustained break below this level could lead to further downside toward $35.62, while a reclaim of $44.73 with volume would suggest a resumption of the uptrend. Investors should monitor volume closely for signs of buyer exhaustion or renewed selling pressure.

Decoding market patterns and unlocking profitable trading strategies in the crypto space
Latest Articles
Stay ahead of the market.
Get curated U.S. market news, insights and key dates delivered to your inbox.


AInvest
PRO
AInvest
PRO




Comments
No comments yet