
Genpact's 15min chart sees KDJ Death Cross, Bearish Marubozu pattern.
ByAinvest
Monday, Jul 28, 2025 3:33 pm ET1min read
G--
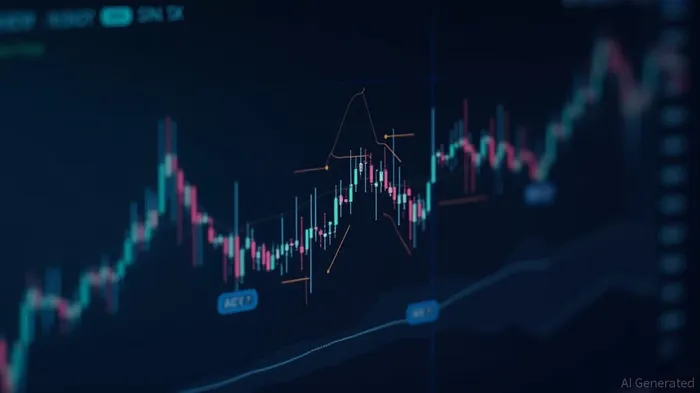
The RSI, a momentum indicator, measures the speed and change of price movements. When the RSI is above 70, the stock is considered overbought, indicating a potential correction. Genpact's RSI value stands at 76.1, placing it in overbought territory [1]. The KDJ indicator, or Stochastic Oscillator, compares a stock's price to its price range over a certain period. The death cross, where the %K line crosses below the %D line, suggests a potential trend reversal. The formation of a death cross at 15:30 on July 28, 2025, adds weight to the indication of a downward trend in Genpact's stock price [1].
The Bearish Marubozu, a candlestick pattern, is characterized by a large body with no upper or lower shadows, indicating strong selling pressure. The formation of this pattern at 15:30 on July 28, 2025, confirms the bearish momentum observed in the KDJ Death Cross and RSI levels.
Investors should be cautious about the potential for further price decline, as both the RSI and KDJ indicators suggest a shift in momentum towards the downside. However, it is essential to consider that technical indicators alone may not provide a complete picture of a stock's performance. Fundamental analysis, including earnings reports and revenue growth, should also be considered when making investment decisions.
References:
[1] https://www.ainvest.com/news/genpact-15min-chart-shows-rsi-overbought-kdj-death-cross-2507-36/
Genpact's 15-minute chart has triggered a KDJ Death Cross and a Bearish Marubozu, which occurred at 07/28/2025 at 15:30. This indicates a shift in momentum towards the downside, with a potential for further price decrease. Sellers are currently in control of the market, and it is likely that this bearish momentum will continue.
Genpact Limited (NYSE: G) has experienced a significant shift in its stock price momentum, as indicated by the formation of a KDJ Death Cross and a Bearish Marubozu on its 15-minute chart. This occurred on July 28, 2025, at 15:30, signaling a potential downward trend for the stock. The Relative Strength Index (RSI) and KDJ indicator suggest that the stock's rapid ascent may be unsustainable, and that sellers are currently in control of the market.The RSI, a momentum indicator, measures the speed and change of price movements. When the RSI is above 70, the stock is considered overbought, indicating a potential correction. Genpact's RSI value stands at 76.1, placing it in overbought territory [1]. The KDJ indicator, or Stochastic Oscillator, compares a stock's price to its price range over a certain period. The death cross, where the %K line crosses below the %D line, suggests a potential trend reversal. The formation of a death cross at 15:30 on July 28, 2025, adds weight to the indication of a downward trend in Genpact's stock price [1].
The Bearish Marubozu, a candlestick pattern, is characterized by a large body with no upper or lower shadows, indicating strong selling pressure. The formation of this pattern at 15:30 on July 28, 2025, confirms the bearish momentum observed in the KDJ Death Cross and RSI levels.
Investors should be cautious about the potential for further price decline, as both the RSI and KDJ indicators suggest a shift in momentum towards the downside. However, it is essential to consider that technical indicators alone may not provide a complete picture of a stock's performance. Fundamental analysis, including earnings reports and revenue growth, should also be considered when making investment decisions.
References:
[1] https://www.ainvest.com/news/genpact-15min-chart-shows-rsi-overbought-kdj-death-cross-2507-36/
Stay ahead of the market.
Get curated U.S. market news, insights and key dates delivered to your inbox.
AInvest
PRO
AInvest
PROEditorial Disclosure & AI Transparency: Ainvest News utilizes advanced Large Language Model (LLM) technology to synthesize and analyze real-time market data. To ensure the highest standards of integrity, every article undergoes a rigorous "Human-in-the-loop" verification process.
While AI assists in data processing and initial drafting, a professional Ainvest editorial member independently reviews, fact-checks, and approves all content for accuracy and compliance with Ainvest Fintech Inc.’s editorial standards. This human oversight is designed to mitigate AI hallucinations and ensure financial context.
Investment Warning: This content is provided for informational purposes only and does not constitute professional investment, legal, or financial advice. Markets involve inherent risks. Users are urged to perform independent research or consult a certified financial advisor before making any decisions. Ainvest Fintech Inc. disclaims all liability for actions taken based on this information. Found an error?Report an Issue

ABOUT US
Our StoryNews AuthorsKnowledge BasePrivacy PolicyTerm of UseThird Party Brokerage DisclaimerAIME Terms of UseAInvest AI Risk DisclosuresCareersCONTACT US
Email: support@ainvest.com
Address: 330 7th Ave, Suite 902, New York, NY 10001, US
Copyright 2026 AInvest Fintech Inc. All rights reserved.
Comments
No comments yet