
Gelteq (GELS) Plunges 24%: A Volatile capitulation in the Software & Services Sector
 Aime Summary
Summary
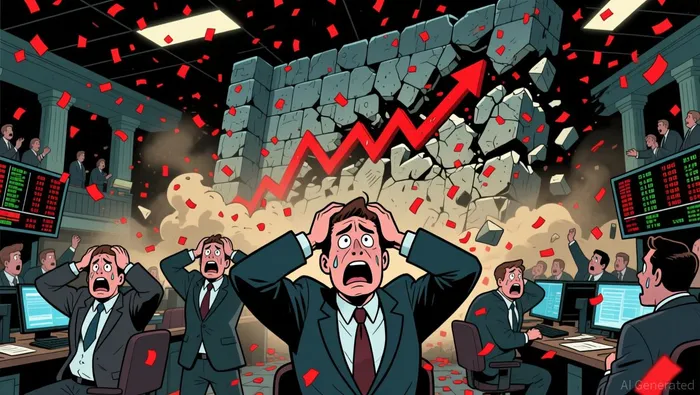
• GelteqGELS-- (GELS) suffers a sharp intraday decline of 24.27%, closing at $0.6816.
• Trading volume surges with a turnover rate of 8.70%, signaling intense institutional and retail participation.

• The stock trades well below its previous close of $0.90 and the 200-day moving average of $0.7394.
• RSI spikes to 80.05, indicating extreme overbought conditions preceding this sharp reversal.
Gelteq’s dramatic intraday collapse represents a significant technical breakdown, erasing recent gains and testing critical support levels. The stock opened at $0.8338 but failed to maintain momentum, sliding to an intraday low of $0.672 before settling near the lows. This volatility underscores the fragility of the current price structure, as the stock struggles to hold above key psychological and technical thresholds amidst broader sector headwinds.
Technical Exhaustion Triggers Sharp Sell-Off
The precipitous drop in Gelteq shares is primarily driven by technical exhaustion and profit-taking rather than specific corporate news, as no recent company announcements were reported. The stock had been trading in a short-term bullish trend but hit a resistance wall near the upper Bollinger Band of $0.815. The subsequent rejection at these levels, combined with an RSI reading of 80.05, signaled an extreme overbought condition that invited aggressive selling. Traders likely exited long positions to lock in profits, causing a cascade of sell orders that pushed the price below the 200-day moving average, triggering stop-losses and accelerating the decline toward the $0.67 low.
Software & Services Sector Weakness Mirrors Gelteq’s Decline
Gelteq’s performance aligns with broader weakness in the Software & Services sector, where even market leaders are not immune to downward pressure. Microsoft (MSFT), the sector leader, experienced an intraday decline of 1.21%, reflecting a cautious sentiment across the technology space. While Gelteq’s 24% drop is significantly more severe than the sector average, the directional move suggests that macroeconomic factors or sector-wide rotation out of high-beta software stocks may be contributing to the selloff. Investors should view Gelteq’s volatility as an amplified version of the sector’s current risk-off posture.
Defensive Positioning and Technical Breakdown Analysis
Given the severe technical breakdown and lack of favorable options data, the trading strategy must focus on risk management and technical level monitoring rather than aggressive speculation. Below are the key technical indicators defining the current setup:
• 200-day Moving Average: $0.7394 (Price is below, indicating long-term bearish trend)
• RSI (14): 80.05 (Extreme overbought, suggesting potential for further correction)
• Upper Bollinger Band: $0.815 (Price rejected from this level, confirming resistance)
• 52-Week High: $2.01 (Current price is significantly discounted, showing long-term weakness)
The technical landscape is precarious. With the stock trading below the 200-day moving average of $0.7394 and the 30-day support zone of $0.55–$0.56, the path of least resistance remains downward. The absence of leveraged ETF data and an empty options chain prevents the construction of complex derivatives strategies. Instead, traders should monitor the $0.67 low for a potential bounce or breakdown. If the price fails to reclaim the $0.7394 level, further downside to the 30-day support at $0.55 is likely. Without options leverage to hedge or speculate, capital preservation is paramount. Aggressive traders might watch for a short-term bounce off the $0.67 low to test the $0.80 resistance, but the trend remains firmly bearish.
As no options contracts were provided in the chain, no specific payoff calculations or contract picks can be generated. The focus must remain on the underlying asset’s technical integrity.
If $0.67 support breaks, expect a rapid slide toward the $0.55 psychological level.
Maintain Caution: Wait for Stabilization Before Re-entering
The current move in Gelteq is likely unsustainable in its current downward trajectory, but a V-shaped recovery is improbable without a catalyst. The extreme RSI reading suggests a technical correction is underway, but the breach of the 200-day moving average confirms a shift in medium-term sentiment. Investors should remain on the sidelines until the stock stabilizes above the $0.70 level or shows clear signs of accumulation. Keep a close watch on sector leader Microsoft (MSFT), which declined 1.21% today, as its stability will influence broader software sector confidence. Watch for a sustained hold above $0.67 or a breakdown below that level to determine the next directional bias.

TickerSnipe provides professional intraday stock analysis using technical tools to help you understand market trends and seize short-term trading opportunities.
Latest Articles
Stay ahead of the market.
Get curated U.S. market news, insights and key dates delivered to your inbox.


AInvest
PRO
AInvest
PRO




Comments
No comments yet